Read summarized version with


On a real plant, the morning standup’s OEE, the afternoon quality review’s batch list, and the Sunday night SAP close should all point at the same number. The plant’s business systems, its shop-floor controllers and sensors, and the spreadsheets nobody wants to own are the actual sources a modern factory has to reconcile. This guide explains how a working manufacturing data management program turns those sources into one governed route into BI, predictive maintenance, digital twins, and AI, measured in seconds of latency rather than days of waiting. Use it to shape a manufacturing data strategy that holds up across plants, and to benchmark what mature data management for manufacturing looks like when every system stops being its own island.
Manufacturing Data Is Everywhere — and Still Hard to Use
Build the Data Foundation
We develop and manage custom data solutions, powered by proven experts, to ensure the fastest delivery of structured data from sources of any size and complexity.
The plant floor has never produced more data, and operators have never trusted it less. The Overall Equipment Effectiveness (OEE) number disagrees with the floor, and the CMMS logs work orders nobody closed. That is not a model problem — it is a data foundation problem, the kind that appears wherever the plant’s core systems and sensors grew up with no shared layer underneath.
Six pain patterns keep coming back:
- IT and OT (operational technology) systems do not talk. One batch rarely shares an identifier across ERP, MES, SCADA, and the historian.
- Teams define the same metric differently. "Yield" can mean three things on a single plant.
- Machine signals lack business context. A PLC tag with no asset or shift metadata is unreadable.
- Data quality and lineage are not trusted. Timestamps drift; units mix metric with imperial.
- Reporting depends on manual reconciliation. An analyst stitches MES, historian, and SAP exports by hand.
- Analytics and AI stall on incomplete foundations. A model trained on this raw landscape inherits every gap.
What Is Manufacturing Data Management?
Manufacturing data management is the operating discipline behind one deceptively simple question: can the plant trust the number on the screen? Often it can’t. The same OEE number gets recomputed by several teams, and the versions quietly diverge. The work runs from raw material receipt to shipped product — collecting the data, joining it, adding context, storing it, and governing who can change it.
That scope has to be wider than machine data. A batch record, a supplier lot, a finance entry — each one can move a production decision, and leaving any of them out makes the dashboard lie in small, expensive ways. A quality model watching MES events alone will miss a scrap-rate spike that ERP saw first. That is why data management in manufacturing cannot be limited to one layer; it has to span IT, OT, and the engineering records the plant quietly relies on.
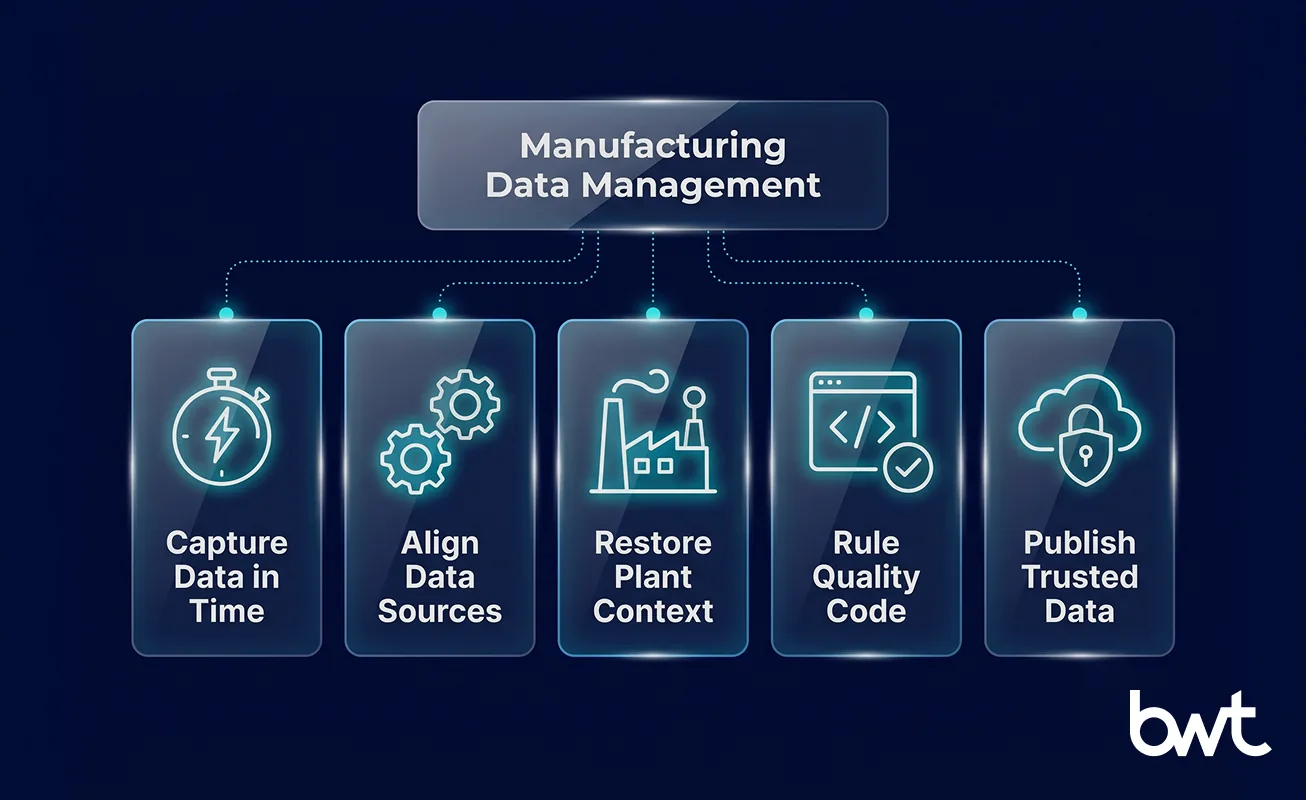
The manufacturing data management framework really has five jobs. Capture the data without losing timing. Line the sources up on one time axis. Restore the plant context each source drops. Put the quality and ownership rules in code, not a wiki. Only then publish trusted feeds to BI, predictive maintenance, and digital twins. That is not a vendor checklist — it is the contract for how every team captures, checks, owns, and delivers data.
Key Takeaways
- Manufacturing data management covers IT, OT, engineering, and business data together, not as separate programs. Treating each layer as its own project is what produces the silos the program is supposed to remove.
- Machine signals without asset, batch, and shift context have limited analytical value. A PLC tag is noise until an asset hierarchy and a shift calendar are attached.
- Master data is the join layer between ERP, MES, QMS, and plant systems. Skip it and the dashboards drift; rebuild it later and the cost runs into months of cleanup.
- Quality controls belong at ingestion. Catching a unit mismatch at the source costs minutes; catching it in a board pack costs a quarter.
- Edge, historian, lakehouse, and warehouse each carry a different workload. Picking one storage tier for every need is the classic vendor-led shortcut that turns into a re-architecture project.
- Governance needs named owners and machine-enforced rules. A wiki nobody opens is not governance; a policy the platform rejects at write time is.
- AI and digital twins depend on lineage, context, and freshness. No lineage, no trust, no deployment.
- Scaling starts with one high-value use case. Broad parallel rollouts increase the dependency surface and starve the pilot before it produces evidence.
Also Read: Building Data Pipelines From 20+ Sources: Playbook
Core Components of Manufacturing Data Management
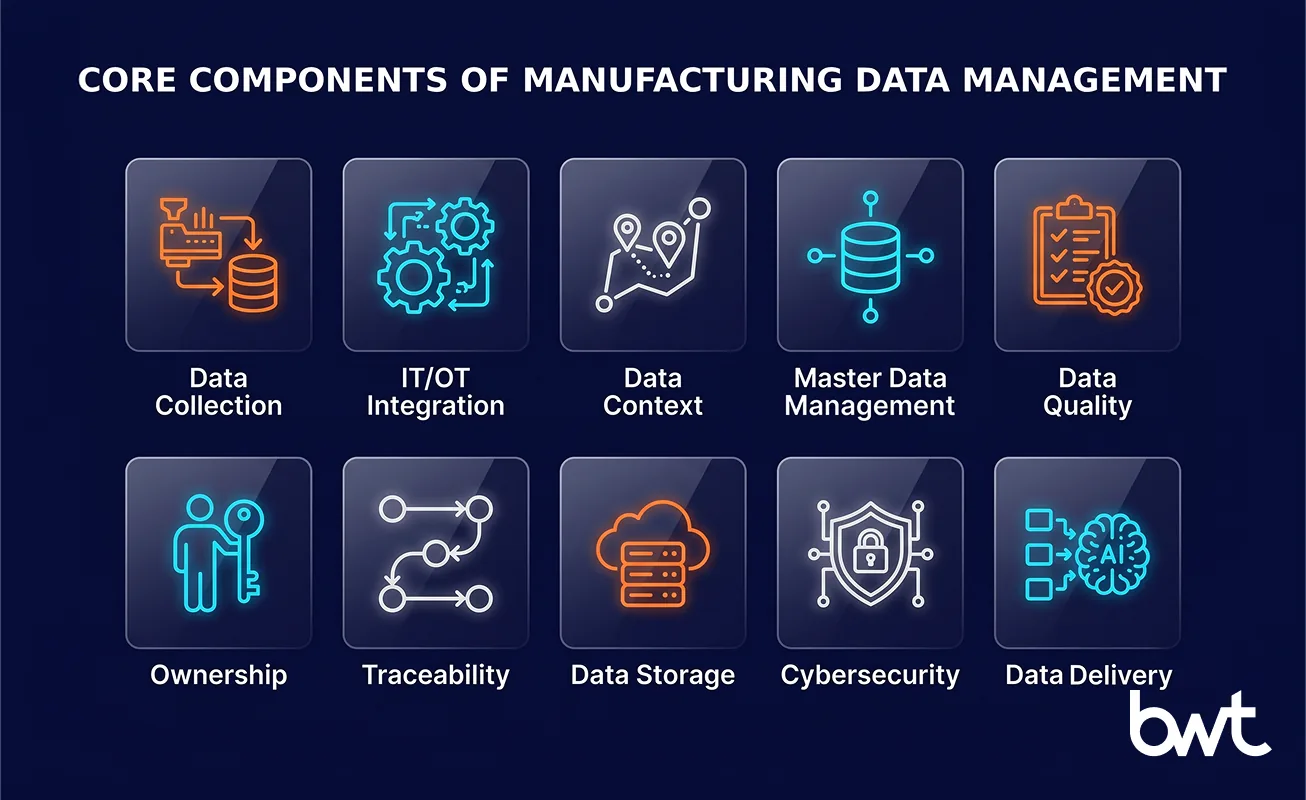
A working framework is less a stack diagram than a set of plant rules that survive the next source system. The 2026 roadmap paper on AI and machine learning for smart manufacturing names the same blockers we see in projects: industrial data is large, uneven, and hard to integrate. Google Cloud’s Manufacturing Data Engine with Cortex Framework makes the vendor version of the point.
Manufacturing Data Collection
Data is born in three places that behave differently: fast machine signals, mid-speed event records, and slow business systems. Capture only one layer and the use case goes lopsided — a model on historian data alone never sees the maintenance backlog.
IT/OT Data Integration
Enterprise systems arrive through clean APIs. OT equipment is messier — it speaks OPC UA, MQTT, or whatever a historian happens to export. The hard part is time: when a machine event and a finance record sit in different zones, someone has to decide when the joined record counts as valid.
Data Contextualization
A tag says something changed; context says what changed, on which asset, during which shift. "In manufacturing, the lineage from a sensor tag back to a batch is the difference between an explainable KPI and one that nobody will sign off in a meeting." — Dmytro Naumenko, CTO at GroupBWT.
Manufacturing Master Data Management
Every product, material, supplier, and machine has to carry one identifier that reads the same in ERP, MES, and the warehouse. Skip that mapping and the dashboards drift apart. Within months each one grows a private translation table that only a single analyst can still decode.
Data Quality Management
Quality checks belong where data enters, not after a spreadsheet has circulated. Validate timestamps, units, and schema changes at ingestion, so a metric/imperial mix-up fails at the source instead of in a board-pack number.
Data Governance and Ownership
Governance works only when someone can say "I own this field" and the team actually believes them. Give each domain a named owner who signs off when a schema lands or a report changes. A poster on the wall never approved a KPI definition; a person does.
The table below spells out who carries which part of the program on a typical plant engagement. The columns reflect the four roles that show up in every RACI; the rows are the activities the operating model has to keep running.
The plant-side roles split along operational and technical accountability.
| Activity | Plant operations | OT |
| Source availability | Consulted | Responsible |
| Quality rules | Consulted | Supports |
| KPI definition | Responsible | Consulted |
| Access control | Consulted | Responsible |
| Incident response | Consulted | Responsible |
The data-side roles carry the build, the certification, and the escalation path.
| Activity | Data engineering | Data owner |
| Source availability | Supports | Accountable |
| Quality rules | Implements | Approves |
| KPI definition | Supports | Accountable |
| Access control | Implements | Approves |
| Incident response | Responsible | Informed |
Data Lineage and Traceability
Lineage is the receipt behind the KPI: source, transformation, quality rule, publish point. The same trail answers a defect investigation — which batch, which line, which shift — turning archaeology into a controlled lookup.
Manufacturing Data Storage and Architecture
Storage should follow workload — historians for high-frequency signals, lakes for raw events, warehouses for BI, edge servers near the line when latency or cost demands it. The expensive mistake is copying one record into five stores with no canonical owner. The full layer-by-layer breakdown of ingestion, contextualization, storage, governance, and consumption lives in the dedicated Manufacturing Data Architecture section below.
OT Cybersecurity and Network Segmentation
OT networks were never built for open internet exposure. Security has to live inside the data program, not beside it. That means applying the zones and conduits model from ISA/IEC 62443: network segmentation between OT, IT, and analytics; controlled remote access with just-in-time credentials; least-privilege service accounts; certificate and credential management on every gateway and broker; secure edge gateways with encrypted transport; monitoring of abnormal data flows on every conduit; backup and recovery for historian and configuration data; and a hard separation between production control workloads and analytics workloads. A tampered feed is a quality failure first and a security event second. The implementation details are covered in NIST SP 800-82 Rev. 3.
Analytics and AI Data Delivery
Dashboards, predictive maintenance, digital twins — they all consume the foundation, and none of them replace it. Industrial AI earns trust only when the plant can point back to the asset, the batch, and the source record behind a number. No lineage, no trust.
Types and Sources of Manufacturing Data
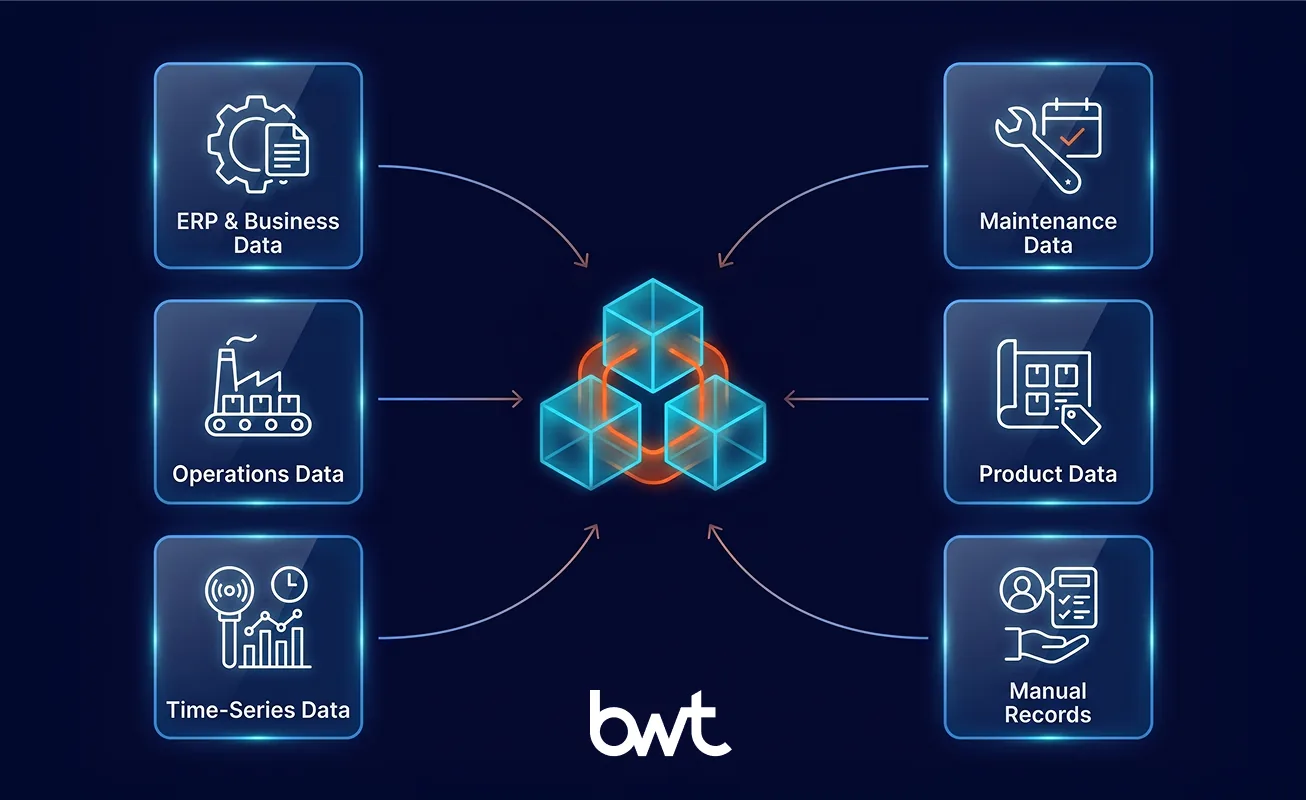
A working program classifies every source by type before it touches the architecture. Six categories cover most plants, and each one comes with a different context model and a different common failure.
Enterprise and Transactional Data
ERP, finance, procurement, sales orders, and supplier records. These are the slow systems the rest of the plant references for "what should have happened." They define the canonical product, material, and supplier identifiers the warehouse inherits.
Manufacturing Operations Data
MES events, batch records, production orders, work instructions, and shift logs. This is where the plant’s planned activity lives, and where the join back to enterprise identifiers usually happens.
Machine and Time-Series Data
PLC tags, SCADA events, IIoT sensor streams, and historian exports. High frequency, low context — a single historian can hold a billion rows a day, and most of them carry no business meaning until they are mapped to an asset.
Quality and Maintenance Data
QMS inspections, lab results, non-conformances, CMMS work orders, and defect logs. These are the records an auditor will ask for first, and they usually live in the system least connected to the warehouse.
Product and Engineering Data
PLM records, CAD files, BOMs, specifications, and design revisions. The data that decides what should be built, and the source of truth for product changes that never make it back to ERP.

Unstructured and Human-Generated Data
Spreadsheets, paper logs, emails, PDF reports, and operator notes. The hardest category to govern, often the most decision-critical, and the last one most programs formalize.
Source-System Matrix
| Data type | Typical source | Required context | Common problem |
| Machine signals | PLC, SCADA | Asset, timestamp, state | Missing business context |
| Production events | MES | Batch, line, shift | Inconsistent identifiers |
| Maintenance | CMMS | Asset hierarchy | Unclosed work orders |
| Product data | PLM, ERP | SKU, BOM, version | Conflicting versions |
| Quality data | QMS, lab systems | Batch, supplier lot | Weak traceability |
| Supplier records | ERP, portals | Supplier, contract | Stale master data |
Manufacturing Data Architecture
Architecture is the part of the H1 promise most programs underdeliver on, and the part the search query manufacturing data architecture is actually asking about. The pattern below is the same one GroupBWT designs for plants that need a governed foundation today and an AI-ready layer tomorrow.
Edge and Plant-Floor Data Sources
PLC tags, SCADA events, OPC UA servers, and IIoT sensors live on the plant network. Some stream at kilohertz; others report once per shift. None of them carry the business context the warehouse needs — that gets attached downstream.
Industrial Connectivity and Ingestion
Edge gateways (OPC UA, MQTT brokers, vendor-specific historian exports) normalize transport. Pipelines downstream split between batch integration for slow enterprise records and streaming or change-data-capture (CDC) for fast machine events.
Historian, Raw, and Contextualized Data Layers
Historians keep high-frequency signals near the line. A raw landing zone preserves the original event payload for replay and audit. A contextualized layer attaches asset, batch, shift, product, and supplier identifiers — this is where the data finally becomes useful.
Master Data and Asset Hierarchy
Products, materials, suppliers, equipment, lines, and sites get canonical identifiers in an MDM layer. The asset hierarchy (equipment → line → area → site → enterprise) is what makes a sensor reading legible to the rest of the company.
Warehouse, Lakehouse, and Time-Series Storage
Warehouse for governed BI models, lakehouse for raw and curated data products, and time-series storage for sensor data at scale. Picking one tier for every workload is the most common cause of a rewrite in year three.
Semantic and Consumption Layer
Curated datasets, certified metrics, semantic models, and feature stores. This is where "what does OEE mean here" stops being a debate and becomes a versioned definition.
Governance, Security, and Observability
Access control, lineage capture, schema enforcement, and audit trails ride along with every pipeline run — not bolted on after the first audit finding. Observability covers freshness, volume, and quality signals the platform measures automatically.
BI, Digital Twin, ML, and AI Consumers
BI dashboards, OEE scorecards, predictive maintenance models, digital twins, and downstream AI services all consume the same governed layer. The pattern matters: when lineage and freshness hold, every consumer inherits trust instead of rebuilding it.
Architecture-Layer Reference Table
| Layer | Stores what | Typical technology | Workload |
| Edge | Sensor and machine state | Edge gateways, OPC UA brokers | Local aggregation |
| Historian | High-frequency signals | OSIsoft PI, InfluxDB, vendor historians | Time-series queries |
| Raw lake | Original event payloads | Object storage + open table formats | Replay, audit |
| Contextualized | Asset- and batch-keyed events | Lakehouse (Iceberg, Delta) | Curated analytics |
| Warehouse | Certified datasets and metrics | Cloud or on-prem warehouse | BI, semantic layer |
| Semantic | Feature and metric models | Feature stores, semantic layer | ML, AI services |
End-to-End Data Flow
PLC / Sensors / Machines / SCADA
        |
        v
Edge Gateways / OPC UA / MQTT / Historians
        |
        v
Batch / Streaming / CDC Integration
        |
        v
Raw and Time-Series Data
        |
        v
Contextualization / Asset / Batch / Shift / Product
        |
        v
Quality / Master Data / Governance / Lineage
        |
        v
Warehouse / Lakehouse / Manufacturing Data Platform
        |
        v
BI / OEE / Quality / Predictive Maintenance / Digital Twins / AI
A beverage plant where GroupBWT stood up the architecture end-to-end saw the line stoppage-to-alert latency drop from 47 minutes to 90 seconds (company-reported, single-plant internal benchmark). A US multi-site agricultural producer GroupBWT audited kept its BTU monitoring workload on local compute because moving it to the cloud would have roughly doubled infrastructure cost – a company-reported decision from the audit phase, not a delivered migration.
Unified Namespace vs Centralized Data Platform
A Unified Namespace (UNS) is a common pattern in modern plants: every OT and IT source publishes events onto a shared topic structure (typically MQTT), giving teams a single read path. UNS works well as an operational event layer, but it does not replace historical storage, governed analytical models, master data, enterprise reporting, or lineage. Treat UNS as the connective tissue between the edge and the contextualized layer; keep the warehouse and the governance stack as the system of record for decisions.
Data Modeling Standards
Two modeling decisions shape every downstream use case. First, the asset hierarchy: equipment → line → area → site → enterprise, with batch and lot genealogy hanging off the equipment node. Second, a common timestamp strategy: every event carries UTC with a plant-local offset, every report standardizes on the same shift calendar. ISA-95 (the cross-vendor model for integrating enterprise and control systems) and ISA-88 (batch process control) are useful orientation points — borrow the layer names, do not relitigate them. Canonical identifiers for product, asset, and material are decided once and enforced by the MDM layer, not by each consuming pipeline.
Edge vs Cloud — Where Each Workload Belongs
| Workload | Best fit | Why |
| Line-control feedback loops | Edge | Millisecond latency, no cloud round-trip |
| High-volume sensor capture | Edge or on-prem historian | Bandwidth and storage cost |
| Cross-plant aggregation | Cloud | Single pane across many sites |
| Long-horizon analytics | Cloud | Compute on demand, lower storage unit cost |
| AI training | Cloud | GPU access, elastic capacity |
| Sovereign or regulated data | On-prem or regional cloud | Data residency, contractual controls |
How Manufacturing Data Management Improves Operations
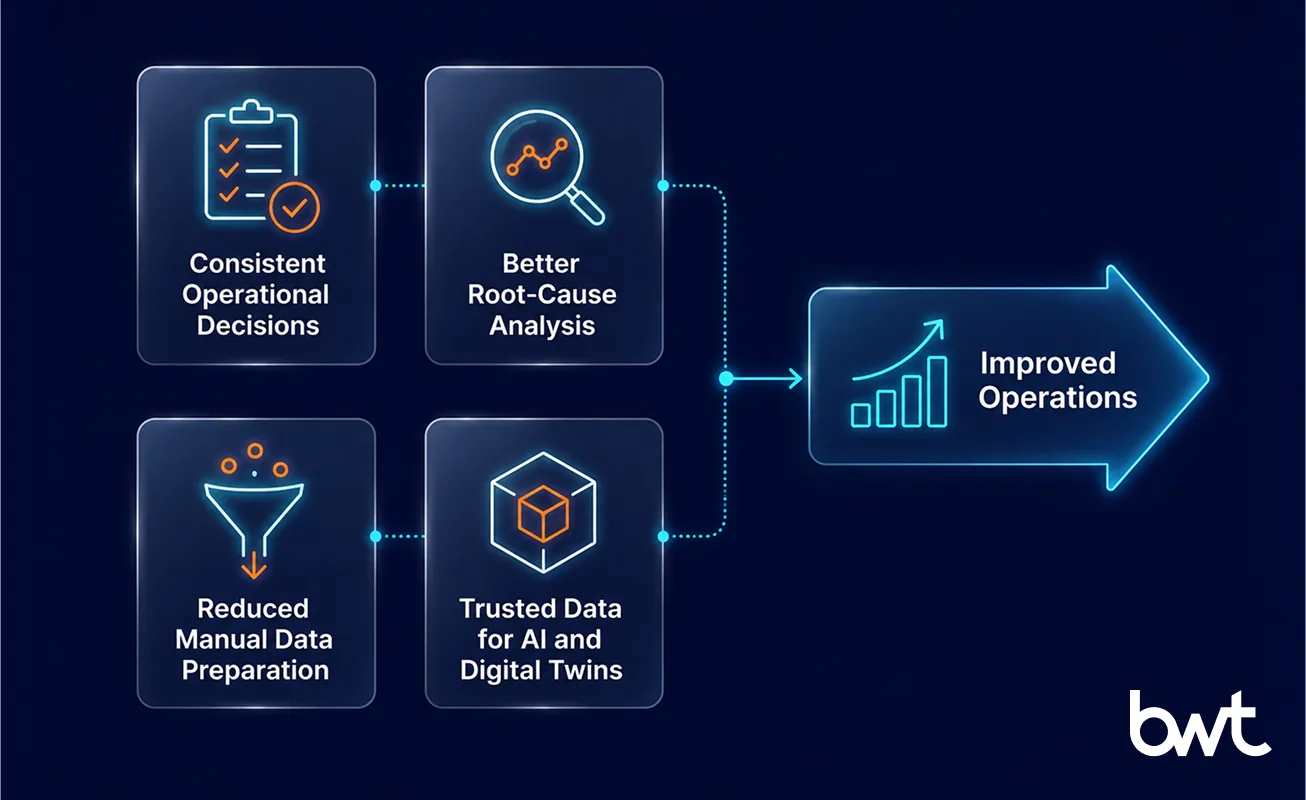
Once data is governed and contextualized, the operating metrics of a manufacturer move. Not by magic — by the practical consequence of finally being able to answer the same question the same way twice. This is what mature manufacturing data management leaders are actually paying for: not a new platform, but a layer that turns twenty-plus disconnected sources into answers the whole plant trusts. Morning standups get shorter once the same OEE is on the wall and on the floor.
Faster and More Consistent Operational Decisions
OEE and production KPIs stop depending on which spreadsheet was emailed last. The morning standup, the weekly review, the board report — all three now read from the same governed layer, so they finally quote the same number. A decision that once waited for the manual month-end close lands within minutes of the event that triggered it. At one beverage plant, that meant the gap between a line stoppage and an alert fell from 47 minutes to 90 seconds.
Better Quality, Traceability, and Root-Cause Analysis
When a defect is reported, the team can trace it from customer complaint back to the specific batch, the specific asset, the operator shift, and the supplier lot. Root-cause analysis goes from a manual correlation exercise to a guided investigation, and the audit trail for regulatory and certification bodies stops being a quarterly scramble — ISO 13485 evidence prep drops from weeks to days (company-reported, single engagement GroupBWT delivered).
Reduced Manual Data Preparation
Manual preparation disappears in stages. The historical snapshots go first, then the recurring extracts, and eventually even the one-off reconciliations that always lived on someone’s desktop. The pattern is not limited to plant telemetry. In an automotive manufacturing RFQ workflow, GroupBWT had AI read supplier replies, certificates, and quote PDFs into one structured comparison inside Oracle ERP, which saved the buyer about 18 hours per custom RFQ (company-reported, single automotive procurement engagement). The same data-management move applies on the plant side: when source records are structured and validated upstream, operations, maintenance, and finance stop rebuilding the same numbers by hand.
“When the validation lives inside the pipeline, the spreadsheet stops being the system of record"”
— Alex Yudin, Head of Data Engineering at GroupBWT
Trusted Data for AI, Digital Twins, and Predictive Maintenance
Predictive maintenance needs three things most plants cannot produce today — a complete asset history, operating conditions with context around them, and freshness you can trust. A digital twin needs one more: a live bridge between the physical state of the machine and its operational state in the data. Both sit downstream of the previous sections — and when the data layer is right, these models become ordinary engineering projects rather than moonshots. A bearing-failure model can move from R&D experiment to nightly batch job once the source data starts showing up clean.
How to Build a Manufacturing Data Management Strategy, Step by Step
The path from a fragmented data landscape to a working program is rarely linear. Plants do not stop producing. The right sequence starts with the business question, not the technology choice.
Step 1 — Define Business Use Cases and KPIs
Start with the business outcome that pays for the investment, not the platform that pays for itself. A good first use case is often boring, useful, and politically safe — a supplier-scorecard rollup across a few plants. OEE accuracy, recall readiness, AI readiness for predictive maintenance, and supplier scorecard consolidation are common early targets. For each outcome, name a sponsor in operations or quality who owns the data domain. Without a named owner, governance is a poster on the wall — and posters don’t sign off on schema changes.
Step 2 — Inventory Data Sources and Owners
List the data sources that matter for each use case, including the Excel hand-offs, and map the actual flow from source to dashboard. The inventory almost always surfaces undocumented sources, one-person SQL dependencies, and reports nobody can explain. At one Tier-1 auto plant GroupBWT audited, the inventory turned up 41 distinct data sources feeding OEE, 14 of which the OT team did not know existed (company-reported, single engagement).
Step 3 — Map Current IT and OT Data Flows
Trace each high-value source through its current movement: which MES pushes to which warehouse, which historian feeds which dashboard, which ERP batch record syncs with which QMS inspection. Most plants discover flows they did not know existed, and at least one of them violates the network segmentation they signed off on earlier.
Step 4 — Identify Quality and Context Gaps
Run a quality pass for timestamps, units, identifiers, schema drift, and missing context attributes. List gaps by source and prioritize the ones blocking the chosen use case. The pilot will surface more, and the architectural shift matters more than per-source cleanup — chasing every gap at this stage is how six-month programs turn into eighteen-month programs.
Step 5 — Design the Target Data Architecture
Decide the data rules before you pick tools. How does each source enter? Where does it live, which fields give it plant context, which quality checks block a bad record, and which dashboard, model, or API finally consumes it? Put the answers on one page an architect can read before reaching for a vendor brochure. Choose stores by workload, not by which one the team already knows — and write the rules down ahead of the vendor demo, not after it. The shortest path to vendor lock-in is choosing the tool, then designing the rules to fit.
Step 6 — Standardize Models and Identifiers
Standardize models and identifiers so the same SKU, asset, batch, and location look the same in ERP, MES, and the warehouse — using whatever format the existing systems already support best. The data foundation stops being a slogan and starts being a contract: a new source either maps to the standard, or it does not land in the warehouse. Refusing a "just this once" schema exception saves months of downstream cleanup later.
Step 7 — Build Integration and Data Pipelines
Build the pipelines that move data from ERP, MES, SCADA, and the rest into the governed layer. Attach master data as each record arrives — asset, batch, order, material, shift — and run the quality checks right there at ingestion. When something breaks, it should break loudly at the source, not at 3 a.m. when the on-call DBA notices the table came up empty.
Step 8 — Add Governance, Security, and Lineage
Wire in governance, security, and lineage while the pipelines are still being built — not after the first audit finding forces it. Naming, units, timestamps, and ownership belong in code; access controls, encryption, and lineage capture should ride along automatically every time the pipeline moves data. Policies that are not enforced by the platform are read by no one — a governance wiki nobody opens is not governance.
Step 9 — Launch a High-Value Pilot
Launch one high-value use case end to end and use it to validate the architecture, prove the value, and build internal credibility. In our experience, enterprise-wide parallel rollouts create a much larger dependency surface than a pilot-first approach — the dependency graph is too wide, and nobody learns the operational patterns until something is in production.
“The temptation to consolidate every source on day one is where most manufacturing data programs quietly die. Pick the use case that pays for the next quarter, build the foundation around it, then expand."”
— Oleg Boyko, COO, GroupBWT
Step 10 — Scale Across Plants and Use Cases
The pattern that works: copy the architecture, not the spreadsheet. Bring the next plant onto the same governance and lineage standards. Treat every new use case as another tenant of the platform, not another bespoke pipeline — and keep a one-page change log so the second-plant rollout does not quietly fork the first one.
Also Read: Data Readiness for AI: A Practical Guide for Data Leaders
Manufacturing Data Management Best Practices
The H1 promises best practices, and the search intent behind manufacturing data management best practices expects a list of habits rather than a vendor pitch. The ten below are the ones GroupBWT pushes into every engagement, drawn from plants where the foundation now holds.
Start With a Business Use Case, Not a Platform
A scorecard for suppliers across two plants, OEE accuracy on one line, AI readiness for predictive maintenance on one asset class — each of these pays for the next quarter without needing a platform decision on day one.
Standardize Time, Units, and Identifiers
Pick a single timestamp strategy, a single unit system per measurement, and a single canonical identifier per product, asset, batch, and supplier. The standards do not have to be the enterprise’s; they have to be the warehouse’s.
Contextualize Machine Data Before Analytics
A PLC tag without asset, batch, shift, and product context is unreadable. Attach context at ingestion, not in a downstream report, so the same signal can feed BI, ML, and audit at the same time.
Validate Data at Ingestion
Required fields, unit ranges, schema drift, referential integrity against master data. Fail loudly at the source — the plant can fix a sensor reading; the board cannot fix a board pack built on bad numbers.
Assign Owners to Data Domains and KPIs
A domain owner signs off when a schema lands or a metric changes. Without one, governance is a wiki and KPIs are redefined quietly by whoever shouts loudest. Cross-reference the operating model in the Governance section below for who does what.
Preserve Source-to-Report Lineage
Source, transformation, quality rule, publish point. Lineage turns a KPI into an auditable answer and turns a defect investigation from archaeology into a lookup.
Separate IT, OT, and Analytics Security Zones
The zones-and-conduits model from ISA/IEC 62443, applied by design rather than as an audit fix. The details are in the OT cybersecurity section further down.
Use Different Storage for Different Workloads
Historians for high-frequency signals, lakes for raw payloads, warehouses for certified datasets, edge servers when latency or sovereignty rules out cloud. One store for every workload is a re-architecture project waiting to happen.
Roll Out One Plant or Domain at a Time
Copy the architecture, not the spreadsheet. Treat every new plant as another tenant of the same platform. In our experience, enterprise-wide parallel rollouts create a much larger dependency surface than a pilot-first approach — and the second plant quietly forks the first when both share a platform team but not a governance owner.
Measure Adoption and Data Reliability
The two metrics that tell the program whether it is working: percentage of critical KPIs with end-to-end lineage, and percentage of feeds meeting their freshness SLA. A program that measures these stops arguing about the platform and starts arguing about the gaps.
KPIs Worth Tracking for the Program
| Objective | KPI |
| Data reliability | Quality-rule pass rate |
| Freshness | Percentage of feeds meeting SLA |
| Integration | Percentage of priority sources connected |
| Context | Percentage of machine signals mapped to assets |
| Governance | Percentage of critical domains with owners |
| Lineage | Percentage of critical KPIs with source traceability |
| Adoption | Active users of governed reports |
| Operations | Time required for root-cause analysis |
Track these monthly. A program with named owners and published lineage hits eight out of eight within the first year; a program without owners watches the freshness KPI quietly drop every quarter.
Implementation Step → Deliverable Reference
| Step | Deliverable |
| Define use cases and KPIs | Named sponsor + outcome metric per use case |
| Inventory sources and owners | Source catalog with domain owners |
| Map IT and OT flows | Current-state data flow diagram |
| Identify quality and context gaps | Prioritized gap list per source |
| Design target architecture | One-page architecture with rules before tools |
| Standardize models and identifiers | Canonical identifier register |
| Build integration and pipelines | Source-to-warehouse pipeline with ingestion checks |
| Add governance, security, lineage | Platform-enforced controls and audit trail |
| Launch high-value pilot | Production use case with measured outcome |
| Scale across plants and use cases | Tenant onboarding playbook |
Manufacturing Data Management in Practice
The following examples are not full MES, SCADA, or plant-floor OT transformations. They show governed data foundations built or designed in adjacent manufacturing, industrial, product, and sensor-data environments — the same capability an IT/OT data management program needs, applied where the proof is real.
How an Agri-Robotics Company Turned Sensor Scans Into Live and Forecast Analytics
A farm robotics company GroupBWT worked with was generating roughly 1.2 TB of raw point-cloud scan data per farm per day, about 10 GB per scan from bed after bed (company-reported, single-farm ingest metrics from an early-phase engagement GroupBWT delivered). — and the data lived on local machines. Operations saw it only through the next-day PDF report, which meant a plant manager was making decisions at 11 a.m. from a chart printed at 6 p.m. the day before.
We built a local-first PostgreSQL foundation on each farm, normalized scan events into room, bed, and size-distribution context, and delivered a live, historical, and forecast dashboard for the operations team. The change the team noticed first was not a metric — it was the disappearance of the daily PDF. Decisions that had waited a day for a printed chart now happened on the spot. The work was an early-phase engagement, not a fully scaled platform; the value lived in the trust the operations team gained in the data they were looking at.
How a Motor Manufacturer Made Engineering Data Searchable Across Six Systems
A European electric-motor manufacturer had engineering knowledge split across SAP, roughly 600 R&D folders, CAD files, sales spreadsheets, Microsoft 365, and ad-hoc AI tools. Engineers could spend half an hour, sometimes an hour, opening files one by one just to confirm which drawing or winding data sheet held the right specification — and that was before anyone asked them to do anything actually productive.
By designing one search layer over the existing systems, GroupBWT helped the manufacturer turn six disconnected stores into a governed engineering-data view without moving the data out of SAP. The design indexes source systems incrementally at about 12,000 files an hour during the backfill (company-reported, measured throughput during the backfill window), extracts parameter tables from CAD/DWG drawings, sends low-confidence values (mostly winding gauges <0.85 confidence) to an engineer for confirmation, and cites the original file behind every AI answer. The result is more manufacturing-specific than a generic BI dashboard: document lookup drops from up to an hour to seconds across 3,600+ motor variants (company-reported, single-catalog scale for the engagement GroupBWT delivered)., while engineers keep working in the tools they already use.
How a Multi-Site Agricultural Producer Mapped a Path Off Legacy Reporting
A US-based multi-site agricultural producer had grown its reporting estate into 6,000+ legacy SQL Server tables and 295 Power BI reports, many of them dependent on one departing senior analyst’s undocumented logic (company-reported, current-state audit counts GroupBWT produced for the engagement)., which is the part that should keep any CIO awake at night. Secomea PLC readings arrived every four minutes; a CheckWeigher needed streaming; a BTU monitoring subsystem ran 24/7 with always-on compute that doubled infrastructure cost.
GroupBWT delivered a current-state audit, a target architecture with raw, cleaned, and analytics-ready data layers, and a staged migration roadmap with governance and lineage design. The roadmap is what the producer is now executing; the engagement was an audit and design phase, not a finished migration. Calling out the boundary matters: an architecture on paper is not the same thing as a delivered platform, and the roadmap explicitly assumes the producer will execute the build with internal and partner teams.
Turn Fragmented Manufacturing Data Into a Trusted Foundation
A mature program pulls every business system, controller, and sensor across the enterprise data landscape into one governed layer — the layer that runs operations today and feeds AI tomorrow. We push teams to sequence it this way for one reason: skip a step, and the usual result is a costly custom reconciliation script that some third-party integrator writes in year one and nobody can maintain by year two.
GroupBWT helps manufacturers audit their data landscape, integrate the highest-value sources, and stand up the governance and lineage the next use case will rely on.
Because every production decision leans on a number from somewhere, and that somewhere is usually wrong. If the number is late, stale, duplicated, or defined differently by two plants, the decision slows down — or worse, speeds up with the wrong number. Good manufacturing data management gives operations one version of OEE, quality teams a traceable path to root cause, auditors a record they can follow, and AI teams inputs that are not already broken.
Manage every record that can change a production call — even the ones nobody admits to having. ERP, MES, CMMS, QMS, and PLM records are the obvious five. Past those sit SCADA events and historian time series, PLC tags and IIoT sensor streams, batch records, lab results, supplier lots, and the long tail nobody governs: spreadsheets, paper logs, email reports. The architecture gets easier the moment you label each source by type — transaction, event, time series, document, or something a human typed in by hand. Leave one type out, and a defect that should take minutes to trace can take weeks.
Master data management (MDM) keeps the shared reference entities — products, materials, suppliers, equipment, locations — consistent across the systems of record. Manufacturing data management contains MDM but reaches past it, into operational events, machine data, quality records, the lineage from a sensor tag to a KPI, storage architecture, governance, and delivery into analytics and AI. Treat MDM as the whole answer and you get the classic result: clean material codes, and still no way to trace a defect back to its batch.
Give each source a route into the governed layer and one shared way to describe time, asset, batch, and product. Enterprise systems usually arrive through APIs and connectors. OT systems may use OPC UA, MQTT, historian exports, or files — sometimes all four on the same line. Bulk records can move in batches; fast machine events may stream. Protocol names matter less than the join: can the ERP order, MES event, SCADA signal, and IIoT reading point to the same production moment?
A manufacturing data platform is the software layer that collects, contextualizes, governs, and serves plant and enterprise data — sitting between the source systems and the people who actually run decisions. In practice, it is usually a stack, not one product: historian, lake, lakehouse, warehouse, governance tooling, BI, and AI delivery. Vendor-neutral teams compose those pieces. Vendor-led platforms bundle more of them together and call the bundle a “solution” — usually at a premium over the components.
Move the controls upstream, even when “upstream” feels too far from where the problem surfaces — the earlier you catch a unit mismatch, the cheaper it is to fix. Names, units, timestamps, required fields, schema drift: check them as data enters the pipeline, not after the monthly report fails review. Give every domain a named owner and steward, and capture lineage the whole way from source to dashboard. Bad data should fail near the source, where the plant can still fix it, instead of downstream in someone’s spreadsheet on a Friday afternoon.
Predictive models need more than sensor history — they need the things sensor history forgets. They need operating conditions, failure records, maintenance work orders, an asset hierarchy, source lineage, and freshness tight enough that the model acts on the current state and not last shift’s. The 2026 roadmap paper on AI and machine learning for smart manufacturing lands on the same point from the research side: industrial AI stalls whenever its source data arrives incomplete, poorly governed, or stripped of context. What makes AI deployable is the data foundation underneath it — not the model you picked on top.
Usually both — pick the storage by the workload, not by the vendor relationship. Keep workloads near the plant when latency, bandwidth, sovereignty, or cost makes cloud-first storage a bad trade. One audit GroupBWT delivered kept BTU monitoring local because moving that always-on workload to the cloud would have roughly doubled its infrastructure cost. Use cloud storage for cross-plant aggregation, analytics at scale, and AI workloads. Hybrid is not a compromise when the placement rule is written down and explicit. It becomes one only when the rule is really just whoever shouted loudest in the last architecture review.
It depends on the estate, the number of plants, and the first use case. A narrow pilot can go live in weeks; data management manufacturing programs that try to cover the whole enterprise in one quarter rarely do. A multi-plant rollout usually takes quarters and should move in waves. Be careful with anyone who quotes one timeline before they have seen the sources; the schedule is governed by the use case and the data condition, not by the tool name on the slide.
Read summarized version with
Tech Stack
Build the Data Foundation
We develop and manage custom data solutions, powered by proven experts, to ensure the fastest delivery of structured data from sources of any size and complexity.