
AI
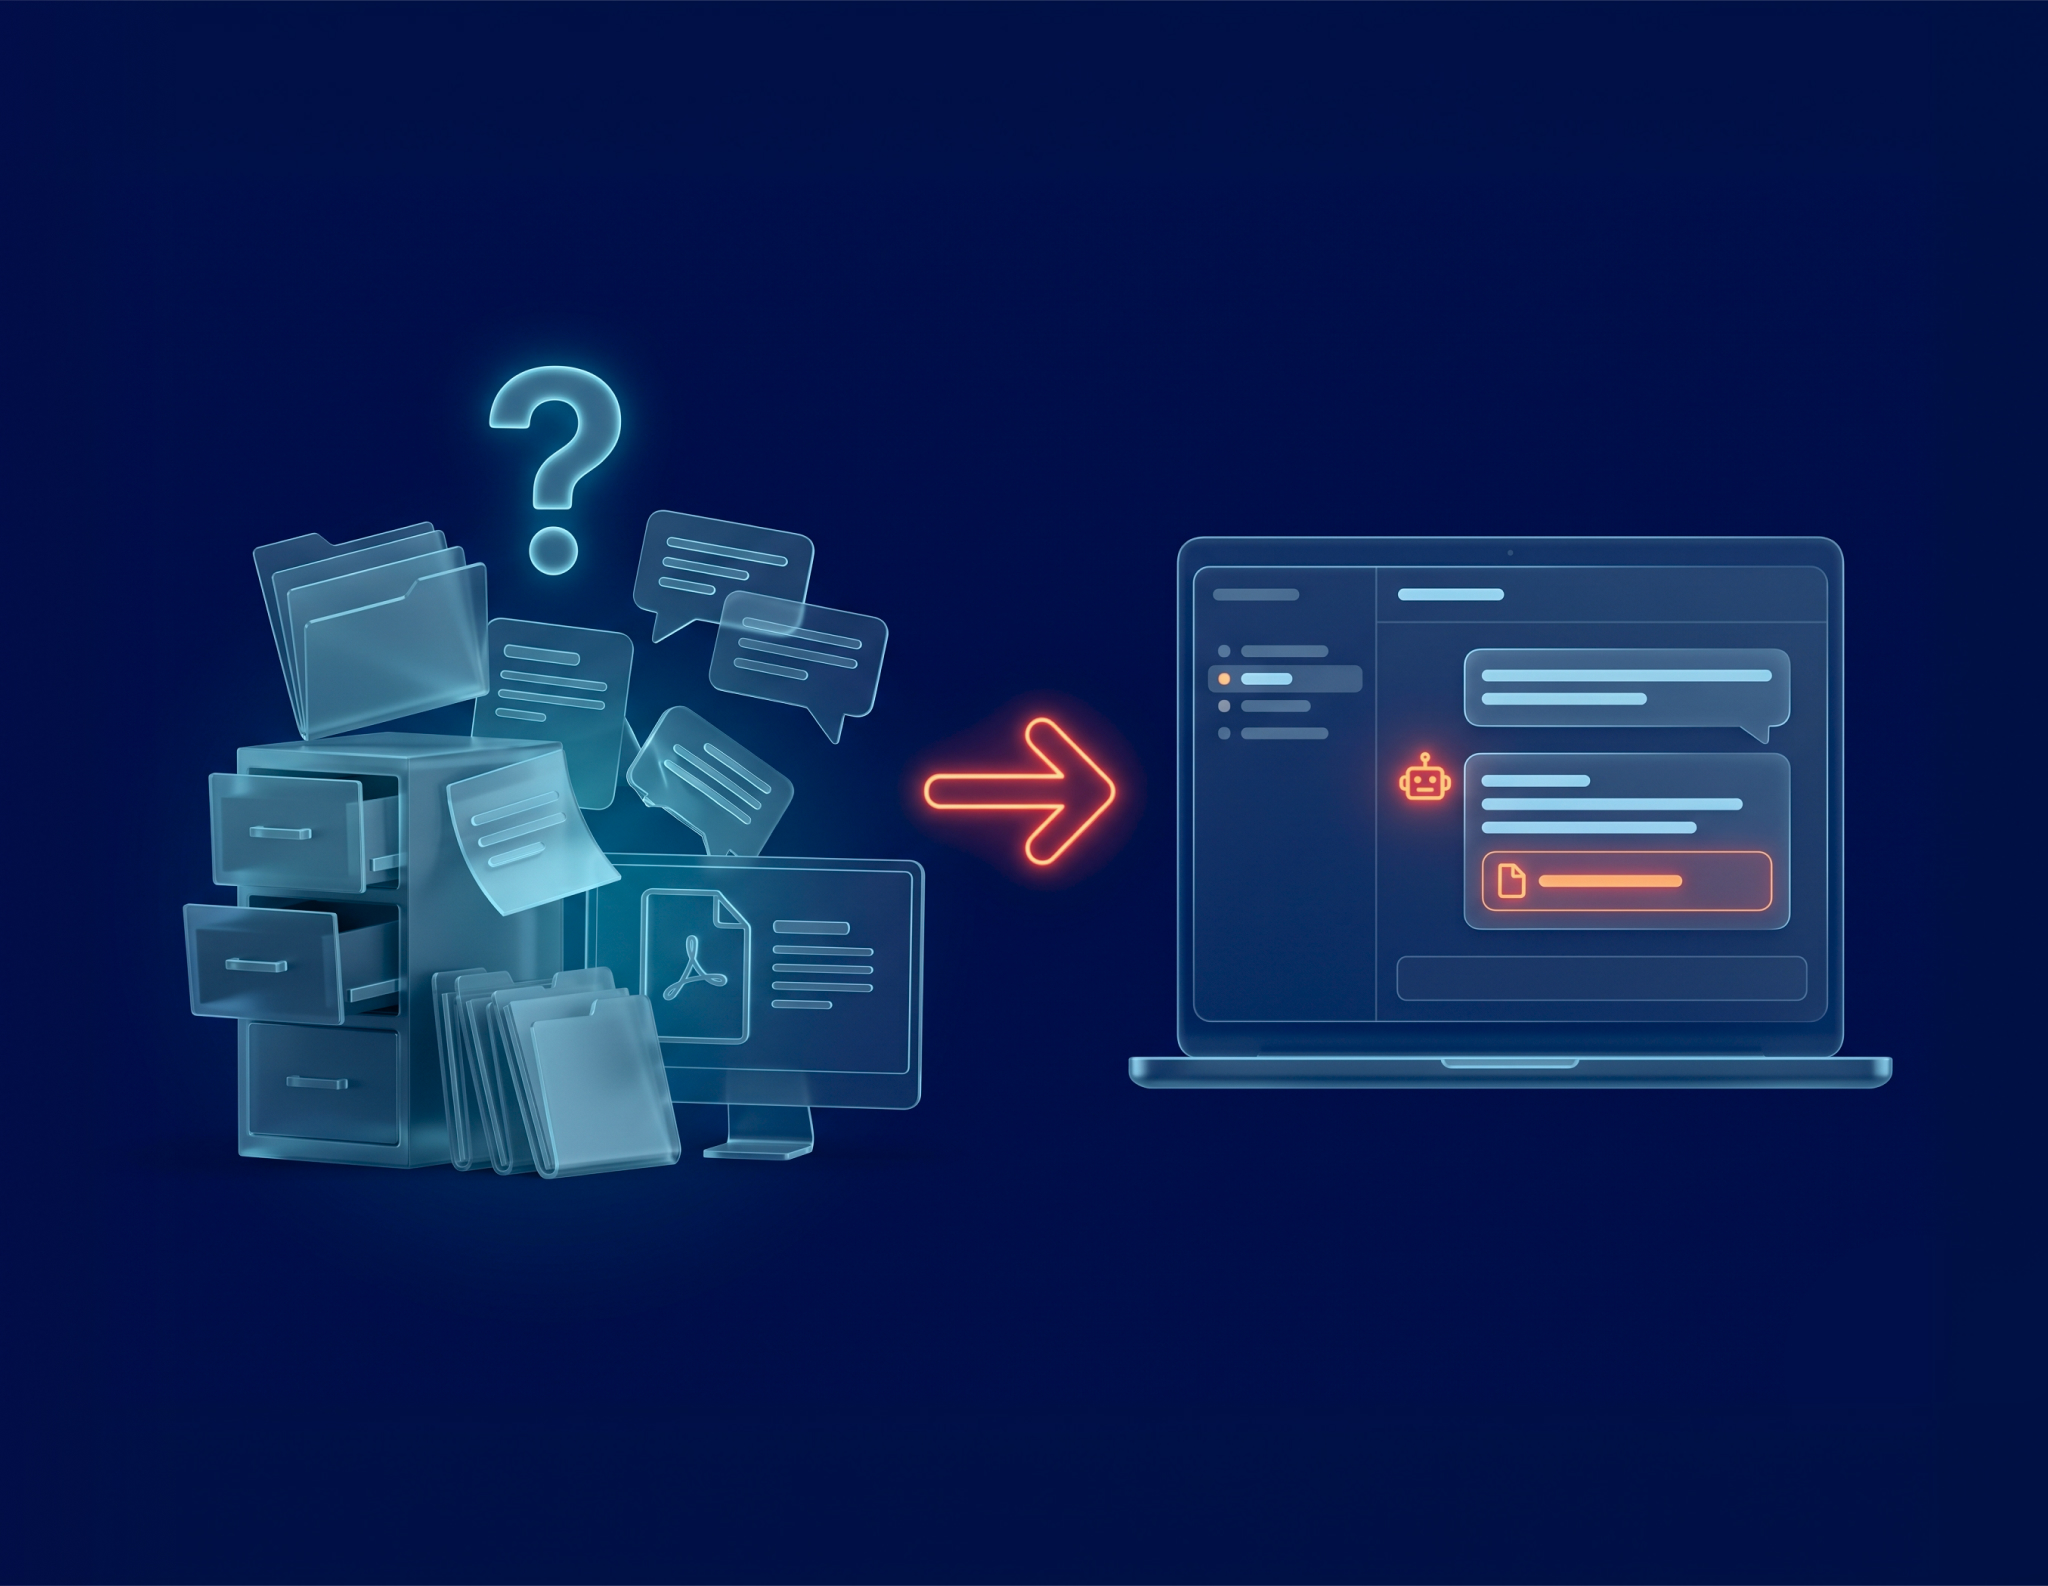
AI Knowledge Assistant Architecture: A Practical Vision for Internal Company Q&A
Introduction An AI knowledge assistant is an internal bot that answers employee questions from your own company documents — policies,...

Manufacturing data analytics services & solutions connect ERP, MES, SCADA, PLC, and IoT data into one trusted data layer — without replacing the systems you already run. GroupBWT builds manufacturing analytics solutions for OEE, predictive maintenance, quality, inventory, and multi-site reporting, served as governed dashboards, real-time alerts, and AI-ready pipelines.







Most plants already generate the data they need — it just never lands in one place a decision-maker can trust. Closing that gap is the whole purpose of data analytics services in manufacturing industry operations, and these six gaps are what push manufacturers to invest.
ERP, MES, SCADA, and IoT were never built to share data, so the true cost of each unit stays hidden, and every team reports a different figure.
KPIs calculated weekly in spreadsheets arrive too late to act on — by the time a trend is visible, the shift that caused it is long over.
Defects surface only after the lot ships, when a correction costs far more than catching the bad batch while it is still on the line.
Without early signals from machine data, maintenance stays reactive, and a stopped line becomes the first sign that something has already failed.
Each plant tracks performance in its own spreadsheets and formats, so leadership cannot compare sites or roll a group number up from the floor.
Demand and inventory planning run on last quarter’s figures, so production runs and stock levels rarely match what the market actually needs.
Below are the day-to-day calls for our data and analytics services for manufacturing support on the floor — each backed by a data layer that makes the number on the screen match the line.
We bring throughput, machine availability, performance, cycle time, changeover time, and schedule adherence into one data layer, so the numbers behind OEE — availability × performance × quality rate — and energy- and emissions-per-unit reporting come from a single source instead of three spreadsheets reconciled by hand.
Control charts are only as good as the data behind them. We run automated data-quality checks that validate every record before it reaches a chart — the same approach we built into a multi-site agribusiness data platform (6,000+ tables across 12 sites) that has been running in production for three years — so your quality team tracks first-pass yield, scrap rate, rework rate, and cost of poor quality (COPQ) on signals it can trust, not on last week’s batch report.
For an automotive parts distributor, we unified a sprawling multi-brand parts catalog (10 brands, 6.3M+ records, up to 100K records a day landing in a 270 GB warehouse) into one clean, de-duplicated master — so planners query a single catalog instead of stitching vendor spreadsheets by hand, cutting manual reconciliation and giving planners a clear read on inventory turns and work-in-progress (WIP). The same de-duplication and master-data pattern applies to the manufacturing supply chain and parts data.
We turn sensor readings, CMMS data, maintenance logs, and operator notes into one time-aligned history — the base a predictive-maintenance model needs to track MTBF, MTTR, and downtime reasons and flag a failure window before the line stops.
We bring orders, inventory, and production history into one forecasting base, so planners size runs and stock to real demand instead of last quarter’s guess.
We link material, batch, machine, and shift records end to end, so when a defect appears, you can trace it back to the lot and line that produced it.


Book a 30-Minute Data Architecture Review
Tell us about your plants, your systems, and the one decision you wish you could make in real time, and we will set up that Data Architecture Review — a focused scoping call, not a sales pitch.
Our Manufacturing Data Analytics Services
We map your sources and KPIs into one target model, so every site reads the same numbers instead of stitching its own spreadsheets.
We land ERP, MES, SCADA, PLC, and IoT data in one governed lakehouse, each source as fresh as the decision needs it.
We build the BI layer on shared KPI definitions, so teams stop arguing over numbers and reports stop lagging.
We answer a live floor question now and a quarterly trend later, from one system — no second warehouse to copy into.
Once the data is clean, we build and run models for predictive maintenance, defect prediction, and demand forecasting.
We catch bad data at the door and govern who can use what, so your analytics and AI run on trustworthy numbers.
Data sources:
Business outcome:
MES, SCADA, PLC, ERP, operator inputs
Better visibility into availability, performance, and quality losses
Sensor data, CMMS, maintenance logs, operator notes
Earlier failure detection and fewer unplanned stops
Inspection data, batch data, SPC, MES, supplier data
Faster root-cause analysis and defect reduction
ERP, WMS, supplier feeds, production plans
Better stock visibility and fewer manual reconciliations
Batch, lot, machine, line, shift, material records
Faster defect investigation and recall readiness
OEE analytics
Data sources
Business outcome
Predictive maintenance
Data sources
Business outcome
Quality analytics
Data sources
Business outcome
Inventory analytics
Data sources
Business outcome
Traceability
Data sources
Business outcome
01
Shop Floor & Operations
The data layer behind shop-floor tools — checklists, status boards, and operator inputs — ensures that what happens on the line is captured cleanly and feeds the numbers leadership sees.
02
Planning & Supply Chain
Demand and inventory dashboards on the same data as operations, so planners and the floor work from one number, not two versions of the truth.
03
Quality & Compliance
Audit-trail systems with multi-year retention, lineage, and access control — the data governance groundwork a quality team builds on for audit evidence, while your auditors own the certification.
04
Leadership & Reporting
Roll-up KPIs across sites, drill down to a single shift or asset, and get exception alerts by Slack or email — the roll-up-and-alert pattern we run on long-running data platforms.
Four steps take you from scattered plant data to decisions your teams trust — each with a clear deliverable before the next.
GroupBWT is a data engineering and analytics partner for asset-heavy and multi-site operations, turning business systems, machine data, sensor streams, and operational KPIs into one governed model for real-time dashboards, predictive analytics, AI use cases, and executive reporting.
Cross-Stack Expertise
Few partners can connect ERP, MES, SCADA, PLC, and IoT data and build manufacturing analytics on top of it — GroupBWT owns the whole chain, from integration to AI.
End-to-End Consulting
Our manufacturing data analytics consulting starts with a data architecture review and runs through build, rollout, and long-term operation — never a one-off project.
A Partner That Stays
We build the system around your data and keep running it — the continuity that separates the top data analytics consulting services for manufacturing companies from a provider that hands it over and leaves.
Practical Delivery
We do not stop when the dashboard works — we train your operators, review KPIs on a regular cadence, and tune the system as your production realities change.
Data You Can Trust
Bad records fail loudly at ingestion instead of slipping silently into a dashboard, so your analytics and AI run on numbers the whole plant can trust.
Proven Track Record
Our strongest delivered work spans asset-heavy, data-intensive operations with the same patterns you face: PLC/ERP integration, multi-site data models, large catalog normalization, data-quality controls, and long-running analytics platforms.









What Our Clients Say

What do you like best?
Their deep understanding of our needs and how to craft a solution that provides more opportunities for managing our data. Their data solution, enhanced with AI features, allows us to easily manage diverse data sources and quickly get actionable insights from data.
What do you dislike?
It took some time to align the a multi-source data scraping platform functionality with our specific workflows. But we quickly adapted and the final result fully met our requirements.

What do you like best?
It was incredible how they could build precisely what we wanted. They were genuine experts in data scraping; project management was also great, and each phase of the project was on time, with quick feedback.
What do you dislike?
We have no comments on the work performed.

What do you like best?
GroupBWT is the preferred choice for competitive intelligence through complex data extraction. Their approach, technical skills, and customization options make them valuable partners. Nevertheless, be prepared to invest time in initial solution development.
What do you dislike?
GroupBWT provided us with a solution to collect real-time data on competitor micro-mobility services so we could monitor vehicle availability and locations. This data has given us a clear view of the market in specific areas, allowing us to refine our operational strategy and stay competitive.

What do you like best?
The company's dedication to understanding our needs for collecting competitor data was exemplary. Their methodology for extracting complex data sets was methodical and precise. What impressed me most was their adaptability and collaboration with our team, ensuring the data was relevant and actionable for our market analysis.
What do you dislike?
Finding a downside is challenging, as they consistently met our expectations and provided timely updates. If anything, I would have appreciated an even more detailed roadmap at the project's outset. However, this didn't hamper our overall experience.

What do you like best?
GroupBWT excels at providing tailored data scraping solutions perfectly suited to our specific needs for competitor analysis and market research.
What do you dislike?
Given the complexity and customization of our project, we later decided that we needed a few additional sources after the project had started.
What do you like best?
What we liked most was how GroupBWT created a flexible system that efficiently handles large amounts of data. Their innovative technology and expertise helped us quickly understand market trends and make smarter decisions.
What do you dislike?
The entire process was easy and fast, so there were no downsides.
What do you like best?
Their deep understanding of our needs and how to craft a solution that provides more opportunities for managing our data. Their data solution, enhanced with AI features, allows us to easily manage diverse data sources and quickly get actionable insights from data.
What do you dislike?
It took some time to align the a multi-source data scraping platform functionality with our specific workflows. But we quickly adapted and the final result fully met our requirements.
What do you like best?
It was incredible how they could build precisely what we wanted. They were genuine experts in data scraping; project management was also great, and each phase of the project was on time, with quick feedback.
What do you dislike?
We have no comments on the work performed.
What do you like best?
GroupBWT is the preferred choice for competitive intelligence through complex data extraction. Their approach, technical skills, and customization options make them valuable partners. Nevertheless, be prepared to invest time in initial solution development.
What do you dislike?
GroupBWT provided us with a solution to collect real-time data on competitor micro-mobility services so we could monitor vehicle availability and locations. This data has given us a clear view of the market in specific areas, allowing us to refine our operational strategy and stay competitive.
What do you like best?
The company's dedication to understanding our needs for collecting competitor data was exemplary. Their methodology for extracting complex data sets was methodical and precise. What impressed me most was their adaptability and collaboration with our team, ensuring the data was relevant and actionable for our market analysis.
What do you dislike?
Finding a downside is challenging, as they consistently met our expectations and provided timely updates. If anything, I would have appreciated an even more detailed roadmap at the project's outset. However, this didn't hamper our overall experience.
What do you like best?
GroupBWT excels at providing tailored data scraping solutions perfectly suited to our specific needs for competitor analysis and market research.
What do you dislike?
Given the complexity and customization of our project, we later decided that we needed a few additional sources after the project had started.
What do you like best?
What we liked most was how GroupBWT created a flexible system that efficiently handles large amounts of data. Their innovative technology and expertise helped us quickly understand market trends and make smarter decisions.
What do you dislike?
The entire process was easy and fast, so there were no downsides.

What do we need in place before we start?
Just your existing systems and someone who knows them. We connect the orders, machines, sensors, and supply data you already produce — you do not need a data team or a finished data warehouse first.
We already have a BI tool. Why add another system?
A BI tool draws charts; it does not fix the disconnected, inconsistent data underneath them. Most teams that “have BI” still reconcile numbers by hand because each source defines a KPI differently. We build the governed data layer your tool sits on — keep the tool, fix what it draws from.
We tried a manufacturing analytics rollout before, and it broke. Why would this be different?
Most failed rollouts break on data quality and ownership: bad records quietly corrupt the dashboards, and the integrator leaves before anyone can maintain the system. We make those errors fail loudly at ingestion instead of slipping through, and we keep operating the platform long-term instead of handing over a brittle build.
How long does it take, and do we have to replace our ERP or MES?
A focused MVP — one plant, one or two KPI families — typically lands in 8–12 weeks; multi-site rollouts and lakehouse migrations run four to nine months. You do not replace anything: we connect the systems you already run and unify them in a separate analytics layer.
How much does it cost, and how fast does it pay back?
Cost scales with the number of sources, data volume, and KPIs in scope, so we price after the Data Architecture Review rather than quoting blind. Most teams see the first payback at the MVP stage — faster reporting and fewer hours spent reconciling numbers.
What are manufacturing data analytics services?
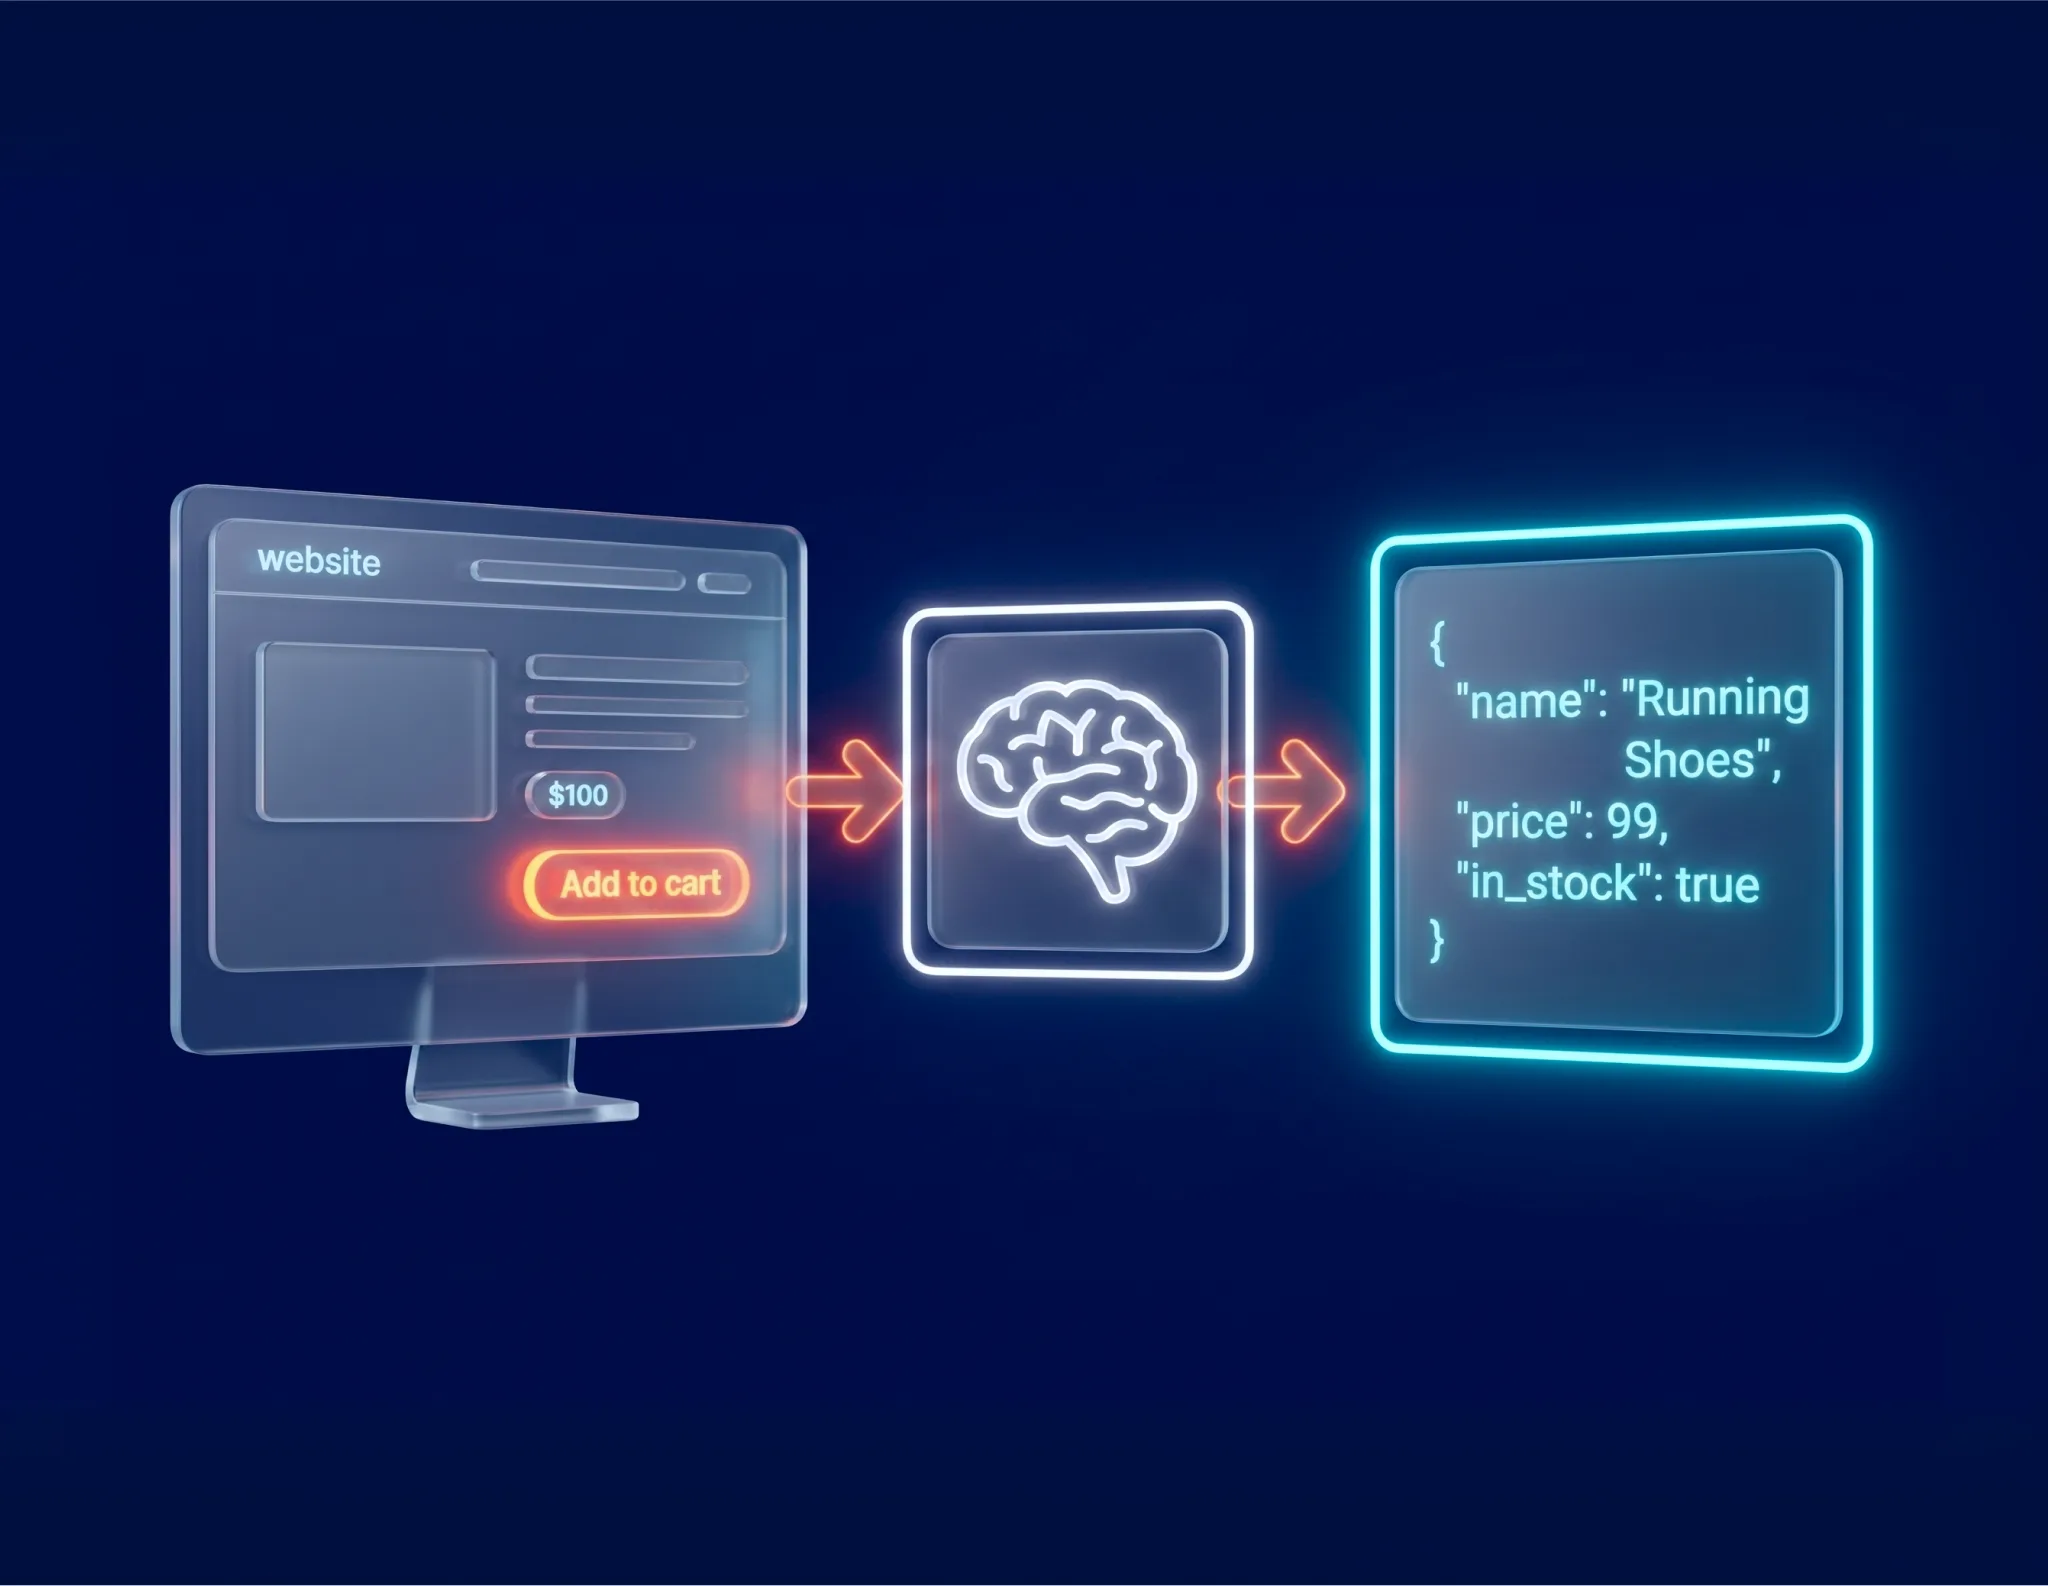
Manufacturing data analytics services connect the systems that run your plant — ERP, MES, SCADA, PLC, and IoT — into one trusted data layer, then turn that data into dashboards, alerts, and predictive models your teams act on. Delivered as ongoing manufacturing analytics services, the goal is one set of numbers everyone trusts, from the shop floor to the boardroom.
How do you build a manufacturing data analytics platform across multiple plants?
We start with a data architecture review, map every source and KPI, then land ERP, MES, SCADA, PLC, and IoT data in one governed model. Each site reports against the same KPI definitions, so you can unify manufacturing data across plants — roll up OEE and quality at the group level, then drill into a single line or shift.
How do you create OEE dashboards from MES and SCADA data?
We align availability, performance, and quality rate from MES, SCADA, and PLC signals against one OEE definition, reconcile the inputs to a single governed source, then surface it in your BI tool. Because the inputs are governed, the OEE number on the screen matches what is actually running on the line — which is how analytics improves both OEE and quality.


How can we help you?

We’ll review your goals and suggest the right solution — technical, scalable, and tailored to you.
What do you need extracted, structured, or automated?