Read summarized version with


- Who this is for: mid-market data leaders — CTO, VP of Data, Head of Data Engineering — consolidating 15+ disconnected systems into one warehouse, at $50M–$500M revenue with 3–15 engineers and no per-source redundancy.
- Best-fit architecture: a Lakehouse with a Medallion layout (Bronze, Silver, Gold) absorbs REST APIs, SQL CDC, IoT streams, and partner flat files in one place, and extends without rewrites.
- Rollout model that works: ship the first source in three weeks, then run sources two through twenty on templates, not bespoke designs.
- Use this approach when: the source count crosses fifteen and every broken feed lands on the same one or two engineers.
- When to build vs buy: buy managed connectors for well-behaved SaaS APIs; build for scraping, partner SFTP, and schema-drift-prone sources — the messy 80% vendors will not cover.
- Avoid templating when: you run fewer than five sources — a single connector or script still wins, and the template tax only pays back past ten.
Data Engineering: From Raw Web to Data Product
We develop and manage custom data solutions, powered by proven experts, to ensure the fastest delivery of structured data from sources of any size and complexity.
We offer:
- Custom Web Scraping & Development
- 15+ Years of Engineering Expertise
- AI-Driven Data Processing & Enrichment
Introduction
This is a practical guide to building data pipelines from 20+ data sources — how to consolidate multiple data sources into one warehouse as a mid-market company, not an enterprise with a team per system. It is written for the CTO, VP of Data, or Head of Data Engineering staring at twenty disconnected systems and the same four questions: what to centralise first, what architecture to pick, what to build, what to outsource.
The short answer this playbook defends: prioritise every source into Critical, Secondary, or As-Is; build on a Lakehouse with a Medallion layout; ship the first source in three weeks; then template the rest. That single architecture choice decides whether adding source twenty-one later costs a week or a quarter — and whether your reporting survives the next broken feed.
By mid-market we mean $50M–$500M in revenue, a data team of three to fifteen engineers, and an internal warehouse without enterprise-grade redundancy. Industry surveys put the typical analyst’s week at 60–80% on data preparation and only 20–40% on analysis. Once the source count crosses fifteen, that gap compounds across every report. Every number cited here comes from GroupBWT’s project archive.

Why Building a Data Pipeline From Multiple Sources Gets Hard Fast
Pipelining one source is a weekend. Twenty is a programme of work. The failure modes change shape at specific source-count thresholds.
What Changes When a Company Grows Beyond 5–10 Data Sources
Below five sources, any tooling works — a Fivetran connector, an Airbyte sync, a Python script — because the surface area is small. Past ten, the problem turns from technical to coordination: schemas drift, two systems claim the same field under different definitions, and the question shifts from “does the code run” to “whose number is right.” For one beauty CPG running a dozen feeds into a single customer data platform, the first thing that broke was the cross-team contract over what a “weekly retailer feed” meant — not the code.
How Data Silos Break Reporting, Planning, and Operations
Finance builds a margin report off the ERP; a category manager builds a promotion report off the marketing warehouse; the two numbers do not match. Both are right inside their own pipeline and useless together — the company has the data but cannot join it. The GAO report on modernizing legacy systems (GAO, 2025) puts the federal version at 79% of IT spend tied up in operations and maintenance; the same dynamic plays out one tier down in mid-market.
Why Mid-Market Teams Feel the Pain Earlier Than Enterprises
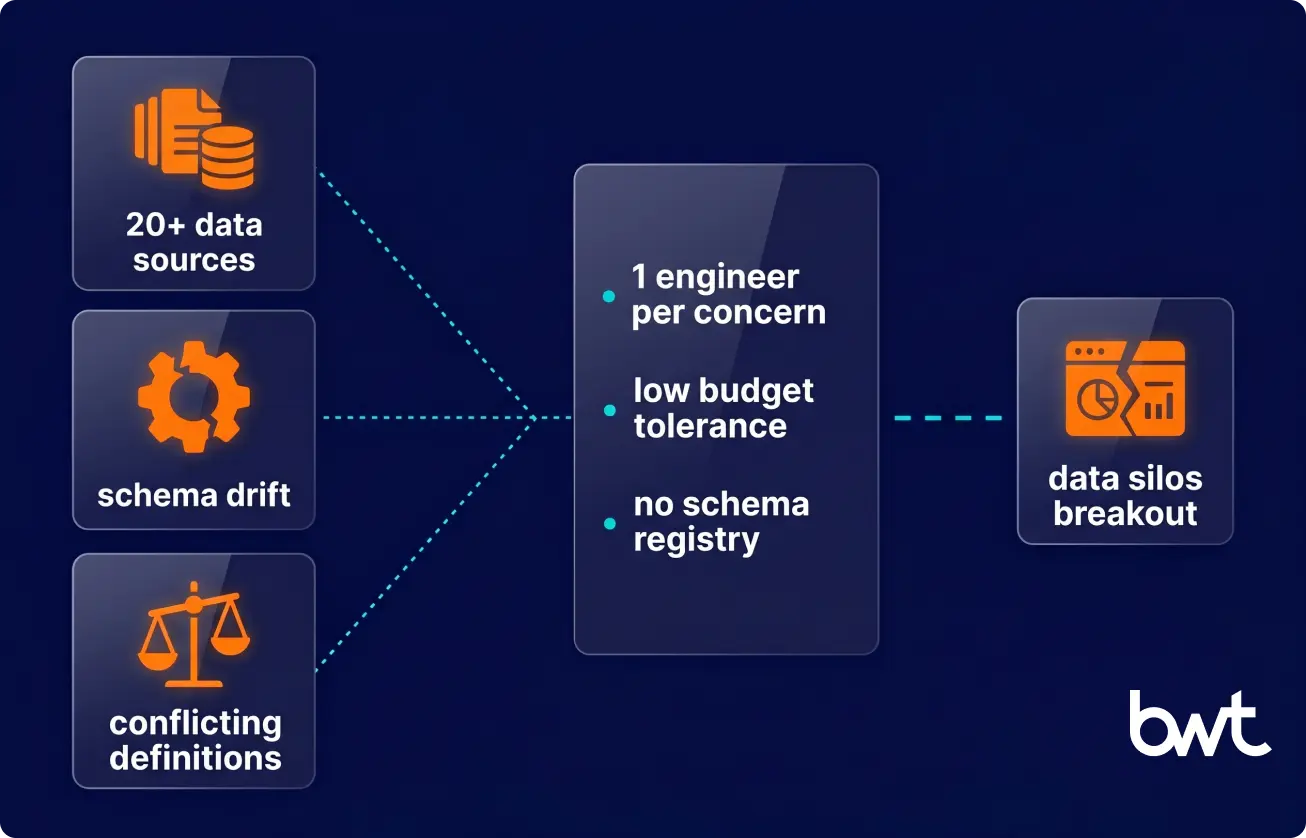
Three structural gaps explain it. Headcount density: an enterprise shares schema knowledge across several engineers; a mid-market team runs one per concern. Budget tolerance: enterprises absorb a $500K connector contract as a line item; the same number makes a smaller-company CFO delay a quarter. Governance maturity: enterprises already run a catalog, a schema registry, and an on-call rota, while smaller teams build those guardrails only after the first outage. So how to build data pipelines at this scale is a different design problem, not a smaller enterprise build.
“In mid-market, the cost of pipeline fragility is paid by the same engineer who built it. There is no second line of defence. The architecture decision you make in week one decides whether the same engineer is fixing it at 2 a.m. in year two.”
— Eugene Yushenko, CEO at GroupBWT
Also Read: Databricks Data Migration for Mid-Market: A Step-by-Step Playbook
What a 20+ Source Data Pipeline Actually Looks Like in Practice
“Twenty sources” is abstract until you count, and the count inflates. Four marketplaces across five locales look like twenty until you notice the locales share one scraper template — one pipeline with twenty configs. What multiplies engineering is heterogeneity of integration pattern, not locale count: in agriculture, twenty means an ERP plus a dozen IoT feeds plus satellite, weather, GPS telemetry, and three SaaS dashboards, each a different pattern. Locale differences live in the Silver layer downstream, not in building the pipeline.
The Reality of Source Sprawl Across ERP, IoT, and Partner Data
GroupBWT built a single Lakehouse for one US agriculture producer that now feeds Power BI off eighteen to twenty heterogeneous sources, documented in our Databricks migration case study: agronomy APIs, SQL change-data-capture from an ERP, IoT streams from field sensors, a managed connector to a financial system, satellite imagery, weather feeds, and flat-file partner drops. According to Google Cloud’s 2025 data integration report (Google Cloud, 2025), unstructured data now exceeds 80% of enterprise data — the forcing function behind this sprawl.
Why 155 Reports Can Depend on One Fragile Integration Layer
That producer feeds 155 in-scope Power BI reports off the single Lakehouse, so when one of the eighteen feeds breaks, executive dashboards go quiet. A multi-source pipeline’s job is not to ingest data; it is to be the single point every downstream question trusts.
The Mid-Market Constraint: Big Data Complexity, Small Team Capacity
Mid-market teams carry enterprise-grade volumes on a fraction of the headcount: one pipeline can track tens of thousands of entities across hundreds of locations, processing hundreds of millions of records a month, run by three to eight engineers. Each row below is what a small team absorbs without buying redundancy:
| Industry context | Source mix | Volume / SLA |
| E-Commerce hyperscaler (Asia) | 1 marketplace, multi-tier scraping | 900K+ products/day peak, sub-minute sync |
| Travel SaaS (UK) | Multiple PMS platforms + OTA pipelines | Hundreds of millions of pricing records/month |
| Public procurement (UK/EEA) | Dozens of tender portals, 100+ scrapers | Hundreds of releases/day, fixed morning SLA |
| Beauty & Personal Care (EU) | 10+ retailers across dozens of locales, plus ad APIs | Weekly SFTP batches, high extraction success |
| Telecom (Germany) | Multiple ISPs × 22M addresses | Multi-batch delivery over more than a year |
| Agriculture (US) | ERP + IoT + satellite + weather + partner files | Mixed sub-hour streams and daily marts |
How to Prioritize Multiple Data Sources Before You Build
Not every source deserves a pipeline on day one. Connecting source twenty-three before sources one through twenty are stable is how teams end up with a half-built warehouse.
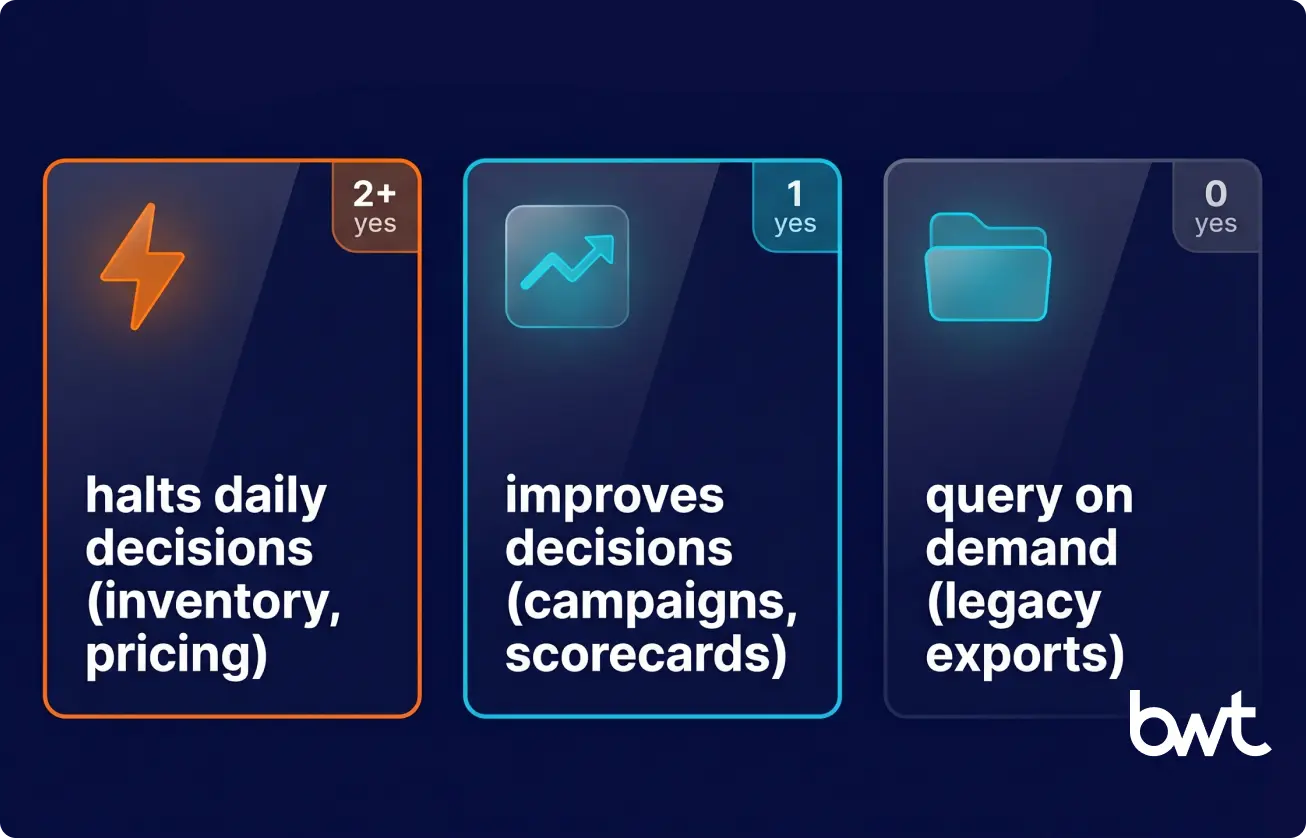
We use three tiers. A Critical source halts a daily decision the moment it is missing — pricing, inventory, financial close. Secondary sources improve a decision without blocking it — campaign performance, supplier scorecards. As-Is sources stay in their system of origin — old ticketing, archived HR files, legal documents — queried on demand rather than piped.
Rank each source against four questions: does a daily executive decision depend on it, is the data available nowhere else, will the format stay stable for twelve months, and will it be joined with at least two other sources? Two yes answers make it Critical, one makes it Secondary, none leaves it As-Is.
On the European beauty CPG above, the first sweep classified 13 retailer feeds plus 5 marketing-API sources into Critical and Secondary, leaving legacy exports and old scorecards As-Is. Only the Critical retailers entered the first templated build, which made the three-week first-source target achievable; reusing one canonical ingestion template across the remaining twelve retailers cut per-pipeline build time roughly five-fold.
What to remember: prioritise before you build — two Critical sources templated well beat twenty half-connected ones.
Data Pipeline Architecture for Multiple Data Sources
The architecture decision matters most the day source twenty-one arrives and the platform either bends or breaks. Treat data pipeline architecture here as the means to surviving the next source, not a broad-architecture survey; for that depth, see our big-data pipeline architecture playbook.
Why a Lakehouse Approach Works for Mixed Operational Data
A traditional warehouse forces every source into structured tables before storage; a data lake stores anything but leaves analysts with the chaos. A Lakehouse keeps a lake’s open-format storage and adds a warehouse’s governance, schema, and transaction semantics. One storage layer (Parquet on object storage) does both jobs, so the same engineer who ingests an IoT feed can query it in SQL, and you stay off a single vendor’s pricing curve. A Lakehouse absorbs REST, SQL CDC, IoT, and partner SFTP without bending any of them.
Medallion Architecture: Bronze, Silver, and Gold Layers
Bronze is raw and append-only, with original field names and source timestamps preserved. Silver is normalised, typed, and deduplicated, with merge/upsert and cross-source joins. Gold is the denormalised data marts that feed BI and AI models — where the producer’s 155 reports read from. Bronze is what you debug against; Silver is where business logic lives. That separation keeps the pipeline interpretable in year three.
When to Use CDC vs Batch Ingestion
Two modes cover almost every source. Batch pulls on a fixed schedule and re-reads a whole slice each time — simple, cheap, fine whenever the business can wait. CDC (change data capture) moves only what changed, so data stays fresh within minutes but costs more to run.
| Scenario | CDC fit | Batch fit | Example |
| Transactional system (ERP, billing) | Strong, 5-min latency | Weak, full re-extract is expensive | SQL Server ERP via CData Sync |
| Sensor / IoT streaming | Strong, natural event stream | Workable via micro-batch | PLC sensors every 4 minutes |
| Partner SFTP / file drop | Weak, no event source | Strong, daily or weekly cadence | Retailer sell-out CSV |
| Web scraping / competitive | Weak, no native change feed | Strong, cadence set by use case | Marketplace pricing scrapes |
The rule for building real time data pipelines is simple: use CDC where the source publishes change events and the business needs sub-hour freshness; default to batch otherwise. Teams overspend by reaching for streaming when daily batch would serve. Whenever a request lands to build data pipeline coverage for a transactional system, that CDC-versus-batch question is the first we answer.
“The Lakehouse only works if you treat the Bronze-to-Silver boundary as a contract, not a convenience. Every transformation that crosses that boundary has to be testable, typed, and reversible. Otherwise the Bronze layer becomes a graveyard nobody trusts.”
— Dmytro Naumenko, CTO at GroupBWT
Research and vendor practice agree. A 2026 arXiv paper on correct-by-design Lakehouses formalises it: schema mismatches that only surface at runtime split development from production, and the fix — typed table contracts and transactional runs — is also the production pattern. On the buy side, AWS’s re:Invent 2025 analytics recap shows catalog federation and direct writes to open table formats, which makes building scalable data pipelines on a Lakehouse a credible default. For the broad-architecture depth this playbook skips, see our data engineering services overview.
What to remember: pick a Lakehouse-plus-Medallion you can defend, then let CDC-vs-batch be a per-source call, not a default.
How to Build a Data Pipeline From 20+ Sources Step by Step
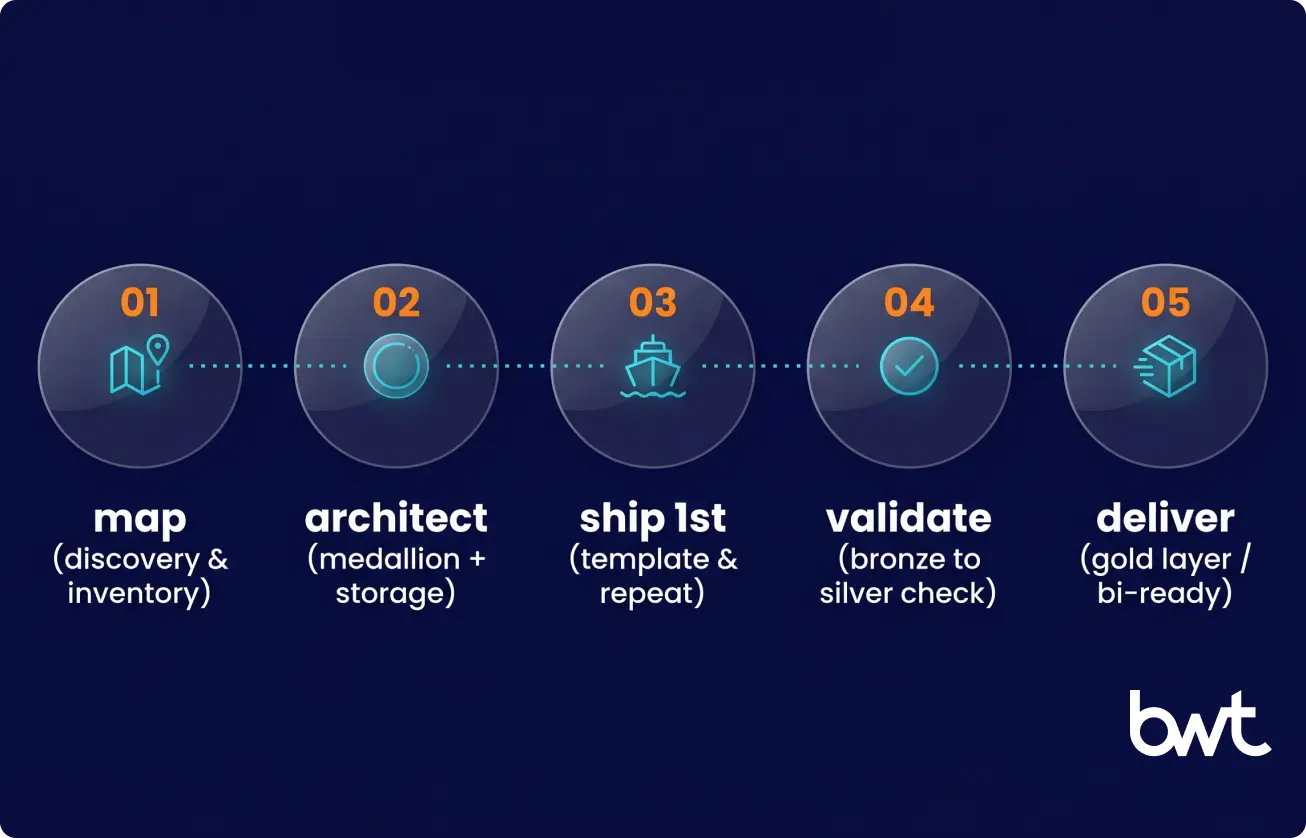
The five-step sequence below prevents a big-bang failure — the practical answer to how to build data pipeline coverage that survives source twenty-one, not just how to build a data pipeline that ships once.
Step 1: Map Systems, Dependencies, and Reporting Usage
Before writing a line of pipeline code, list every source with its consumer, refresh cadence, owner, and the decisions that depend on it. For the agriculture producer, GroupBWT ran a multi-week discovery and inventoried eighteen sources before migration started. Skip this and you rebuild the same pipeline twice.
Step 2: Define the Target Architecture and Ingestion Strategy
Decide the storage layer, the orchestration engine, and the ingestion mode per source; Lakehouse plus Medallion is the default. GroupBWT has used Temporal for long-running ingestions that must guarantee every retry and per-region schedule, Kubernetes CronJobs with ArgoCD for simpler batch work, and RabbitMQ for hyperscale scraping where backpressure matters. Pick one and commit — a two-orchestrator pipeline is twice the operational surface for half the benefit.
Step 3: Build Pipelines Source by Source, Not Big Bang
Ship the first pipeline in three weeks, then run the rest as templates: GroupBWT builds the templated platform on the first source and onboards sources two through twenty without a per-source redesign. The temptation is to scope all twenty up front and burn six months in design, or to build data pipeline from scratch for every new source. Resist both.
Step 4: Reconcile Data and Stabilize Transformations
Validation is the engineering of this step, not a Step 5 add-on. Reconcile every Silver table against its Bronze source: row counts, checksums, and a few business invariants. Engineering at Meta’s account of migrating ingestion at scale (Engineering at Meta, 2026) describes the same pattern — row count and checksum compared between systems. Teams that bake reconciliation into the build see on-call get quieter each quarter.
Step 5: Deliver BI-Ready Marts for Downstream Reporting
The Gold layer is the contract with the business: denormalised, documented, refreshed on predictable windows. A new analyst should join two Gold tables without reading source code or asking the engineer who built them.
Common Challenges in Multi-Source Data Pipeline Projects
Building data pipeline programmes at this scale fail in predictable ways, and the CTO feels it in the wrong place: the engineering hours are invisible, but the board sees the broken data the next morning.
Schema Evolution and API Changes
Upstream contracts break predictably — a retailer renames a column overnight, a vendor deprecates an endpoint, a partner switches to a new Avro schema without telling anyone. The defence is a validation framework at the Bronze-to-Silver boundary that catches drift before it touches Gold. On one multi-retailer matching pipeline, a stable product identifier vanished from the page where it had lived for two years; the validation layer caught the empty field on day one, paused the join for that retailer only, and alerted the team — the retailer had simply moved it elsewhere on the page. Fail loud and isolated, not silent and global.
Data Quality Gaps Across Operational Systems
Twenty operational systems do not share keys: a customer is cust_id in CRM, account_number in billing, an email address in support. Reconciling them is a project, not a step — standardised xref tables in Silver, owned by one team, keep the joins honest. On a German fiber-overbuild platform, GroupBWT ingested more than 22 million addresses whose double-digit mismatch rate would have poisoned every downstream join; a custom address-normalisation layer in Silver brought it to single digits before any report read it.
Maintenance Overhead and Pipeline Failures
Multi-source pipelines fail at the edges. Competitive sites add TLS fingerprinting, retailer portals add browser-challenge gates, partner dashboards add two-factor flows, and regional marketplaces roll anti-bot changes every few weeks. On a multi-platform food-delivery data pipeline, each app ran a different defence on its own cycle; the cost compounds when five sources change in one quarter. The defence is graceful degradation on the critical feeds: on any source-side failure the cache returns last-available data while an alert routes to on-call — a per-source design decision, not a default on every pipeline.
Team Sizing Problems in Mid-Market Environments
Three engineers can run a five-source pipeline indefinitely; the same three keep a 20-source pipeline alive only if the architecture does most of the maintenance. The lever is templating, monitoring, and reconciliation, not headcount. A workable 15–20-source floor: one senior engineer owning the architecture and Silver contracts, two or three mid-level engineers owning ingestion templates and on-call, and one analytics engineer owning Gold. Drop below that and the rota fails; skip the Gold owner and analysts stop trusting the warehouse.
“Each anti-bot stack is operationally a separate source. Five food-delivery platforms with four different defences are not a five-source pipeline. They are five engineering tracks that happen to land in the same warehouse. Costing them as one number is how budgets blow up.”
— Alex Yudin, Head of Scraping at GroupBWT
Build vs Buy: When to Use Tools, In-House Teams, or a Partner
Vendor blogs say buy; engineering blogs say build. The honest answer is a mix that depends on which 20% of the work the vendor covers.
Where Fivetran and Similar Tools Fit Best
Managed connectors win the long tail of well-behaved SaaS sources — Stripe, Salesforce, HubSpot, Microsoft Dynamics, Google Ads — because the vendor maintains the API contract, handles auth refresh, and survives upstream changes silently. They work when a source is high-volume, well-documented, and unlikely to need custom logic. The agriculture producer uses a managed connector for its financial system; building it in-house would waste time on a solved problem.
What Still Requires Engineering Judgment
The other 80% is where you build a data pipeline with custom engineering: scraping publicly accessible competitor sites within their published terms, partner SFTP feeds with idiosyncratic schemas, semi-structured PDFs, documented mobile-app APIs where licensing allows, and any source that crosses a regulatory or contractual boundary. GroupBWT maps each custom source’s legal and contractual constraints during scoping, before engineering starts — something vendor tools cannot price for, so they refuse to cover it.
| Dimension | In-house team | Vendor connector | Hybrid partner |
| SaaS sources with stable APIs | Overkill | Strong fit | Wasted spend |
| Scraping, anti-bot, partner portals | Possible but slow | Out of scope | Strong fit |
| Schema drift handling | Strong if disciplined | Variable per vendor | Strong with SLA |
| Time to first source | 6–12 weeks | 1–3 days | 3 weeks |
How to Think About Build vs Buy for Mid-Market Companies
A small in-house team doing everything ships slowly and burns out; a pure vendor strategy quietly leaves 30% of the source list uncovered. Companies at this scale end up hybrid by year two whether they planned for it or not — and the rigour required to build, implement, and run data pipelines reliably across that hybrid separates a programme from a permanent fire drill.
What to remember: build vs buy is not either/or — buy the well-behaved 20%, build the messy 80%, and expect a hybrid by year two.
What a Realistic Multi-Source Pipeline Timeline and Cost Look Like
When a team starts building a data pipeline from scratch across 15 to 20 sources, cost turns on three drivers: source-type mix (REST APIs are cheap, partner-portal scraping is expensive, IoT and CDC fall between), freshness (daily batch costs a fraction of sub-hour CDC), and team model (in-house is slow, partner-built is fast, hybrid sits between).
In current GroupBWT engagements, partner-built spend for a 15–20-source programme falls in three bands keyed to source-mix complexity — whole-engagement numbers covering discovery, the Lakehouse build, ingestion, reconciliation, monitoring, the Gold marts, and handover. A single source on its own runs $5K–$30K depending on auth, anti-bot defences, and reconciliation depth, but the per-source price misleads: most of the value sits in shared infrastructure, not any one source.
| Band | Profile | Delivery & pod | Partner-build cost |
| Low | Stable SaaS connectors only, daily batch, managed warehouse | 4–5 months, 2–3 engineers | $80K–$150K |
| Mid | SaaS + ERP CDC + partner SFTP + 1–2 scraped sources | 5–7 months, 3–5 engineers | $180K–$350K |
| High | 20+ sources with anti-bot scraping, sub-hour CDC, IoT | 6–9 months, 6–8 engineers | $350K–$650K |
These are partner-build ranges at GroupBWT’s blended European rate card; in-house builds in the US or UK front-load salary cost and stretch the calendar 30–50%, and a regulated-data scope (GDPR Article 9, PCI Level 1) adds 15–25% to effort. Cloud infrastructure is a separate $2K–$8K per month — worth budgeting because it scales with data volume, not source count.
What to remember: price the engagement, not the source — the shared infrastructure is where the cost and the value both live.
Best Practices for Building Data Pipelines From Multiple Sources
A handful of habits separate teams building data pipelines that age well from those whose pipelines quietly rot.
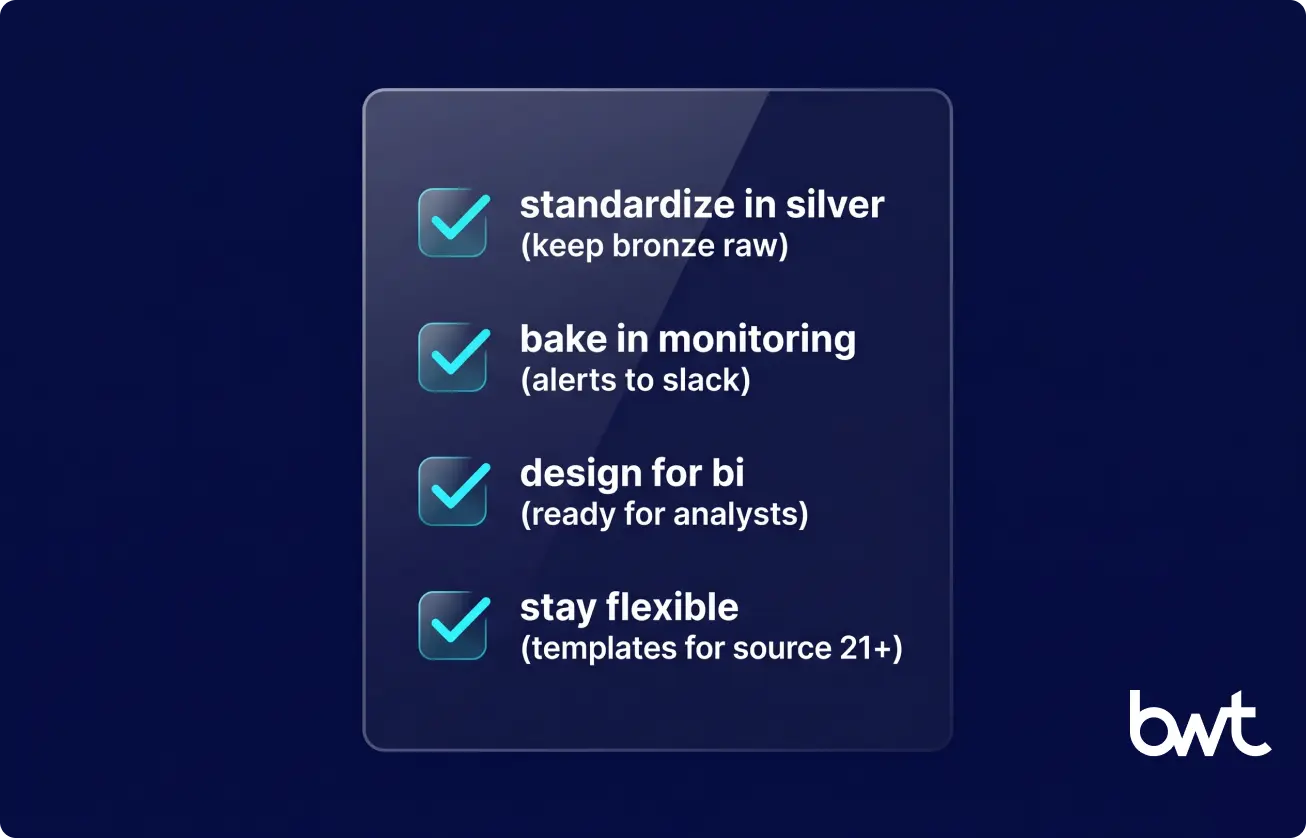
Standardize Early, but Not Too Early
Field names, units, timezones, and currency conversions belong in Silver, not Bronze. Bronze keeps the source as-is; Silver normalises, so when a source changes only the Silver job re-runs and the original ingest stays as the audit trail.
Treat Monitoring and Alerting as Part of the Build
A pipeline without alerts is Schrödinger’s pipeline — possibly working, with no way to tell until a stakeholder complains. Five core alerts per source (volume deviation, freshness lag, schema change, error rate, end-to-end success) go to Slack, each with a clear on-call owner.
Design for BI Consumption, Not Just Raw Ingestion
The Gold layer is the product: if the analyst must join four tables and recall a business rule to get a sensible answer, the data engineering work is not done.
Keep the Architecture Flexible for New Sources
Source twenty-one is coming. Templated builds and shared utility libraries are how mature teams build data pipelines that absorb new sources without renegotiating the whole design.
Summary
The companies that win map their sources before they ingest them: they prioritise Critical over Secondary over As-Is, pick a Lakehouse-plus-Medallion architecture they can defend, and ship source-by-source on templates. Monitoring and reconciliation are part of the build, and build vs buy is a false binary — the realistic answer is a hybrid that names which 80% still needs engineering judgement. The test for any team building a data pipeline from scratch at this scale: in year two, does adding source twenty-one cost a week and an alert rule, or a quarter and a rewrite?
If that test is what you are optimising for, here is what a typical engagement looks like.
Need Help Building a Data Pipeline From Multiple Sources?
If the source list on your whiteboard has more than fifteen entries and the setup feels held together by one SQL view that a single person understands, that is the moment to bring in help — before the next planning cycle, not during it. GroupBWT works with mid-market data teams on building data pipelines across heterogeneous source mixes. Pick the first step that matches where you are:
- Get a 20-source pipeline assessment. We inventory every source, classify it Critical / Secondary / As-Is, and return a phased ingestion order with owners, cadences, and the reports each unblocks.
- Map your first 5 critical sources. A scoped plan for the Lakehouse and Medallion build — Bronze / Silver / Gold on Databricks, Snowflake, or BigQuery — with validation contracts written into code, not a wiki.
- Find the fragile join before your next planning cycle. A reconciliation and monitoring read: row-count, checksum, and business-invariant checks plus the five core alerts per source, routed to your on-call.
- Get a source-prioritization and architecture review. Templated ingestion across REST API, SQL CDC, IoT, partner SFTP, and scraping, plus BI-ready Gold marts and a run-state handover with runbooks and a stabilisation window.
We have shipped this in E-Commerce, Retail, Beauty & Personal Care, Travel, Real Estate, Automobile, and Telecom.
The first conversation is a 30-minute discovery session. We list the sources, name the reports, and find the fragile join — and you leave with a schedule, a budget band, and an architecture decision your engineering lead can defend. Book a slot through our data engineering services page or reply to the next outreach we send.
For mixed operational data, a Lakehouse with a Medallion layout is the most defensible default. It absorbs heterogeneous source modes without forcing premature normalisation, gives a queryable raw layer for debugging, and isolates business logic — without locking you into one warehouse vendor as the source count grows.
Cost scales with three drivers: number and type of sources, freshness, and team model. A 15-source pipeline on stable SaaS APIs and daily batch costs a fraction of a 20-source one with anti-bot scraping and sub-hour CDC. Budget a multi-month effort for the first ten sources, then a declining curve from source eleven on if templating is done well.
The useful answer is a way to choose, not a tool list. Classify each source by how it delivers data — change events, scheduled batch, live stream, file drop, or scrape — and pick one tool per mode: managed connectors like Fivetran or Airbyte for SaaS APIs, CData Sync for SQL CDC, Kafka or Kinesis for event streams, custom Python or Scrapy for scraping. Storage lands on Databricks, Snowflake, or BigQuery; dbt transforms; orchestration goes to Airflow, Dagster, or Temporal. Naming each source’s mode matters more than the brand.
When the in-house team is smaller than three engineers and the source count exceeds ten, or when a first-of-kind source type appears the team has never integrated. Outsourcing the first version of an unfamiliar class — IoT, partner portals, regulated data — buys time and a reusable pattern the team later extends. It is the most direct way to learn how to build a data pipeline at this scale without losing your senior engineer.
A documented REST API adds in about a week on a templated pipeline; a partner SFTP feed with an unknown schema takes two to three weeks with reconciliation; scraped sites with active anti-bot defences are the slow case at four to eight weeks. The maintainability question matters more than the launch — a new source should not destabilise the existing nineteen, which is what templated contracts and isolated jobs buy you.
Read summarized version with
Data Engineering: From Raw Web to Data Product
We develop and manage custom data solutions, powered by proven experts, to ensure the fastest delivery of structured data from sources of any size and complexity.
We offer:
- Custom Web Scraping & Development
- 15+ Years of Engineering Expertise
- AI-Driven Data Processing & Enrichment