Read summarized version with



Street-level and satellite imagery can enrich a business record with physical attributes: building footprint, a range for service capacity, visible doors and entrances, parking, yards, drive-through lanes, and changes over time. Street-level imagery provides façade-level detail, while satellite imagery shows the footprint and the layout. Neither source is sufficient alone, so reliable business data enrichment combines both and keeps capture dates, geometry, confidence, and an identity check with every estimate.
Most small businesses have no filings, no careers page, and often no website. Nearly all of them have a building, and nearly every building has been photographed twice: from the road, by a car with a camera on its roof, and from above, by a satellite. The first article in this series, on business data enrichment, described how we combine those two views with listing photos and websites to count service bays. The second, on entity resolution for customer lists, was about making sure the building is the right one. This third and last article stays with the two cameras because they are the layers that exist for almost every record with an address, and because getting them right is mostly craft.
Build the Data Foundation Your AI Models Need
We develop and manage custom data solutions, powered by proven experts, to ensure the fastest delivery of structured data from sources of any size and complexity.
We offer:
- Custom Web Scraping & Development
- 15+ Years of Engineering Expertise
- AI-Driven Data Processing & Enrichment
Everything below comes from the same working prototype as the first two articles, with the numbers and the frames. It covers how we choose panoramas, headings, and dates, what a capture from 2008 looks like, why the nearest panorama can be indoors or next door, how a satellite tile turns into meters, and where each camera is blind. The method is simple to state, and the pipeline section below states it in seven steps. The details are where the answers come from, and where the wrong answers come from too.
Key Takeaways
- Street-level and satellite imagery reveal different parts of a business, so the pipeline combines them. The road sees doors, signage, and access, while the satellite sees the footprint, the rear wing, and the lot.
- The nearest panorama is not always the most useful. For one tire store, it was shot inside the showroom, and for one repair shop, it dated from 2018, while the newest view stood 68 meters away.
- Capture dates must travel with every image. About half the panoramas in our sample were from the last two years, and two rural addresses had nothing newer than 2008.
- Several dates at one address can reveal a change of business or operator, such as a lot that held boats in 2022 and trucks under an “auto repair” banner in 2024.
- Satellite imagery is best for footprint and layout, not exact internal capacity. With a parked car as the ruler, a roof becomes meters and a capacity range, but the tile never shows the inside.
- Every visual estimate should keep its uncertainty and source limitations. The year of the count, the walls no camera saw, and a possibly shared building travel with the number.
Also Read: GTIN Product Matching in Web Scraping
How the Street View and Satellite Pipeline Works
For each address, the pipeline fetches several panoramas rather than one, aims several frames at the building from each, keeps the capture dates, adds two satellite tiles at different scales, and gives all of it to a vision model with the geometry attached. The seven steps below are the short version, and the sections after them show the cases behind each step.
Select Multiple Panoramas
A street-level panorama is taken from wherever the camera car happened to be, which is rarely in front of the door. So, for each location, our Street View data extraction step asks for up to four panoramas: the nearest to the map pin, requested within 150 meters, the one the map service itself matches to the street address, and two more about 45 meters along the road in either direction. Each of the four has its own role, which the next section explains.
Capture Multiple Headings
From each panorama, we take three frames aimed at the building: straight on and 35 degrees to either side (the heading, in the service’s vocabulary). The two primary positions add one zoomed frame each. That makes up to 14 frames per address, and in our sample, it was 10 to 14 for more than nine locations in ten.
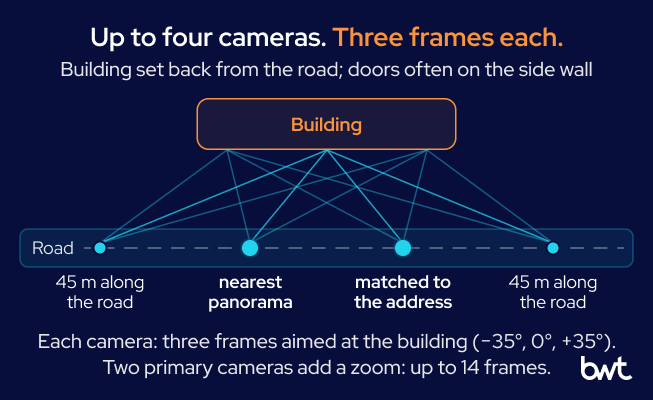
The pipeline places up to four cameras along the road, and each takes three frames fanned across the building, so a door on a side wall has a chance to appear in at least one of them.
Record Distance and Capture Date
Every frame is labeled with its distance to the building, its heading, its capture date, and whether the panorama was official or contributed. The model reads the labels, and they decide how much weight each frame gets. Carrying those labels through storage and every later step is plain pipeline work, the kind that data engineering solutions are built for. How old the imagery can be is the subject of the freshness section below.
Retrieve Satellite Tiles
For the view from above, the pipeline takes two satellite tiles per location, roughly 160 and 80 meters across at the latitudes in our sample. The width is not a constant: the Bing Maps tile system documentation shows how each zoom level doubles the width of a Mercator map and how the ground covered by one pixel changes with latitude.
Estimate Scale and Layout
Because the width changes, the first thing to do with a tile is to establish scale. Scale comes free with the tile because a parked car is about 4.5 meters long, and there is almost always one in view. With that ruler, a roof becomes meters, and meters become a capacity range. The shape of the building and the markings on the ground then show how the site is used.
Compare the Two Sources
The model reads the street-level frames and the tiles together, with the geometry attached, because each camera is blind where the other one sees. Together, the two views turn an address into location intelligence about the business behind it. A short row of doors under a long roof is the kind of conflict this step exists to catch.
| Source | Best for | Weakness |
| Street-level imagery | Façade, doors, signage, and access from the road | Misses rear wings and side walls the camera did not face |
| Satellite imagery | Footprint, wings, yards, lanes, and parked vehicles | Shows no interior and no ownership |
The other two layers, listing photos and business websites, come from the open web through web scraping services, and the first article covers how they refine the count.
Flag Uncertainty and Conflicts
The output is a range with its reasons, not a single number. The estimate states which year the count comes from, lowers its confidence when the newest view of a service wing is years old, and names what no camera saw. A shared building or a conflict between the two sources travels with the number as a written caveat. The validation section near the end covers how to check those flags against reality.
How to Select Street-Level Panoramas for Business Analysis
The panorama nearest to the map pin, the point the map service gives for the business, is not necessarily the one that sees the building. Buildings sit back from the road behind parking, and the useful detail is often on a side wall.
How far the nearest camera is from the building matters more than it sounds because a frame from 100 meters shows a roofline, and a frame from 15 meters shows a door. In our sample, the median was about 30 meters, which is a parking lot’s depth. One location in twelve had no panorama within 100 meters. The 150-meter request is a preference, not a limit. The service may answer with a slightly farther panorama, and the other lookups are unbounded, so the farthest we accepted stood about 170 meters from the address.
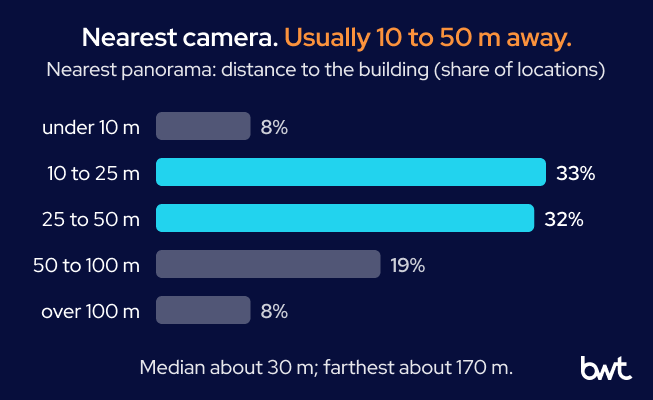
The nearest camera stood within 25 meters of the building for four locations in ten and more than 50 meters away for a quarter of them.
Fetching four panoramas instead of one is a deliberate trade between cost per record and coverage, the kind of design decision we settle in AI consulting work before a pipeline runs at scale.
“Asking for one panorama per address is the cheap design, and its cost shows up later as a confident count of the wrong wall. Four positions and three headings cost more per record, but they turn a side wall nobody photographed into a gap the estimate can name.” — Dmytro Naumenko, CTO at GroupBWT
How to Balance Image Distance and Recency
The panorama nearest to the building and the most recent one are often not the same panorama, and the pipeline has to want both. For one repair shop in a long industrial building, the nearest camera, 12 meters from the door, had passed in 2018 and looked straight into an open bay with a lift inside. The most recent camera, from 2025, stood 68 meters down the road and showed the building as a stripe behind a parking lot.
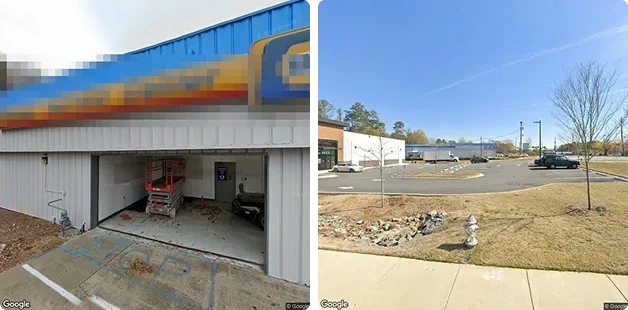
Two cameras show the same shop. On the left, a 2018 frame taken 12 meters away shows an open door and the equipment inside it. On the right, a 2025 frame taken 68 meters away shows the building, but nothing can be counted. The old frame carries the detail, and the new frame carries the proof that the building still stands. Imagery © Google. Signage pixelated.
The lesson is not “prefer the nearest” or “prefer the newest.” It is to fetch both, keep the labels on every frame, and let the model that reads the pictures weigh them. In the final estimate for that shop, the door count came from the 2018 frames, and the estimate flagged that the service wing had only been seen in 2018. The 2025 frame shows that the building is still there, which is what a newer frame is for.
When the Nearest Panorama Is Indoors, or Next Door
Not every panorama was taken by a car. Business owners and photographers upload their own, and the map service serves them beside the official ones. Google Maps Help even advises contributors to take photos from the street and continue until they are inside the place. Contributed panoramas can stand in exactly the right place, and they can stand somewhere a car never goes.
For one tire store, the nearest panorama to the pin, 14 meters away, had been shot inside the showroom: a corridor with red doors, which is honest evidence about the wrong thing. The panorama matched to the street address, 38 meters away, was a contributed one too, but it stood in the lot and showed the whole row of service doors. For a quick lube, a shop that changes oil in drive-through lanes, the search 45 meters along the road returned a contributed panorama captured inside a building with a checkered floor, glass doors along a side wall, and a tire display. Nothing in the quick lube’s own photos looks like that. It is the inside of a neighbor.
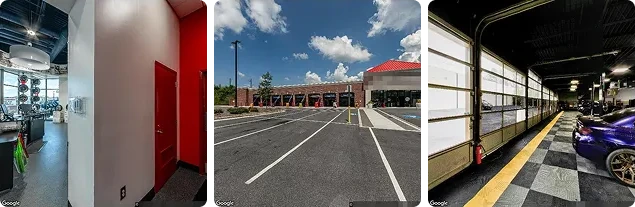
These are three contributed panoramas. On the left, the panorama nearest to a tire store’s pin was taken indoors, so a pipeline that takes the nearest panorama and stops would have measured a corridor. In the middle, the panorama matched to the same store’s address stands in the lot and shows the arches of the service bays in one view. On the right, a panorama 50 meters from a quick lube’s pin was taken inside a workshop that is not the quick lube. Imagery © Google and contributors. Signage and contributor names pixelated.
Two things follow. First, the role of a panorama matters as much as its distance. The one matched to the address is the better bet for the façade, the nearest one is the better bet for detail, and the ones along the road exist to catch the side wall. Second, every frame has to be judged on what it shows, not on where it was taken. The step that decides whether a picture shows the business at all, described in the first article, exists for exactly these frames.
How Fresh Is Street View Imagery?
Street-level coverage is refreshed where the traffic is, so it is refreshed unevenly. In our sample, about half the panoramas the pipeline used were captured in the last two years, and six locations in ten had a frame from the current or the previous year. But one location in sixteen had nothing newer than 2019, and two rural addresses had nothing newer than 2008.
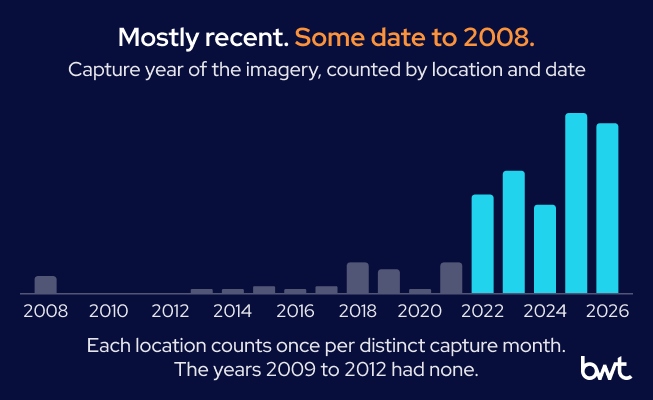
Most of the street-level imagery the pipeline used is from the last few years. A few locations had nothing newer than the mid-2010s, and two rural addresses had nothing newer than 2008.
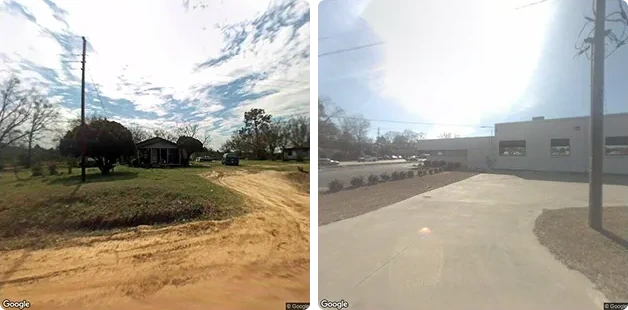
This is what 2008 looks like. On the left, the camera nearest to a mobile mechanic’s billing address passed along this dirt road about 170 meters away, eighteen years ago, and there is nothing to count. On the right, a city hall frame from the same era is washed out and low in resolution, and the 2025 frame of the same building appears in part 2 of this series. Imagery © Google.
An old frame is not useless, but it has to be treated as a claim about the past. A building can change hands, an operator can change, and a lot full of boats can become a lot full of trucks. Because the capture date stays on every frame, the model that writes the estimate can say which year the count comes from and lower its confidence when the newest frame of the service wing is years old. How precise that date is depends on the panorama. The Street View metadata documentation notes that the date holds a year and a month for some panoramas and only a year for others.
That label is cheap to keep and costly to lose.
“A frame without its capture date is a fact without a timestamp: the model cannot weigh it against a newer one, and a reviewer cannot tell a closed shop from an old photograph. The date has to travel with the picture through every step, including the ones that never look at it.” — Alex Yudin, Head of Data Engineering at GroupBWT
GroupBWT applied the same rule in a custom data lake for external market signals: every record keeps its source and timestamp, so analysts can trace a change back to the raw snapshot that first showed it.
Several Dates Are a Change Detector
Half the locations in our sample had panoramas from more than one date, and that turns a static source into a crude but real change signal. The clearest case is the one from the first article: a lot that held boats in 2022 and trucks under an “auto repair” banner in 2024. For one quick lube, the 2022 frames showed the previous operator’s name on the canopy, while the shop’s own current photos show the new one. The building and the use are the same, the customer is different, and a frame says so.
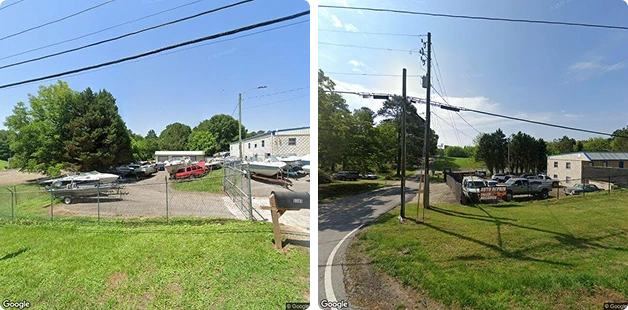
These frames show the same address 22 months apart. In June 2022, the lot held boats, and by April 2024, a banner read “auto repair” and the yard held trucks. Two dates turn a photograph into a before and an after. Imagery © Google.
The change signal is coarse. It tells you that something is different between two dates, not what. A 2026 study of repeated Street View captures of unchanged streets shows how coarse: re-photographing a street that had not changed moved a vision-language model’s perception score by two-thirds of the average difference between two streets in the same city. A difference between two dates is still enough to flag a record for a closer look, and a flag is exactly what a pipeline that runs without an operator needs to produce. GroupBWT’s AI product matching for retail catalogs works the same way: pairs the model is unsure about go to an analyst review queue rather than into the output.
What Satellite Imagery Can Reveal About a Business
The satellite tile is the layer that sees what street level structurally cannot: the whole footprint, the wing at the back, the yard, the second building, and the lot full of vehicles that shows how busy a place is. Satellite imagery analysis does three jobs here. It measures the building, reads its shape, and reads the ground around it.
The first job is size. For one wheel-repair shop, the street-level frames showed a treeline and a lot full of vehicles. Against the parked-car ruler, the tile showed a single metal building of roughly 20 by 50 meters with vehicles packed along both long sides. That suggests doors on the side walls and a shop of several work positions, the places where a car is worked on. The pipeline’s own caveat on that record is the point of part 2 of this series. The customer’s name was not found at the address, so the roof may belong to a neighbor, and the estimate carried that risk in writing.
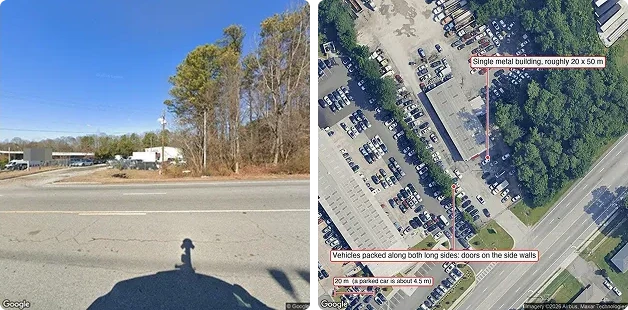
The street sees a treeline, while the satellite sees the building: roughly 20 by 50 meters against the 20-meter bar, with vehicles on both long sides. The doors are probably on the side walls, which no camera on the highway could see. Imagery © Google; satellite imagery © Airbus, Maxar Technologies. Signage pixelated.
The second job is shape, which tells you what kind of shop it is. A showroom on the road with a long wing behind it is the layout of a dealership or a collision center. A pavilion with a row of doors facing the lot rather than the road is a new-build tire store. In both cases, a camera on the road sees the front and counts almost nothing.
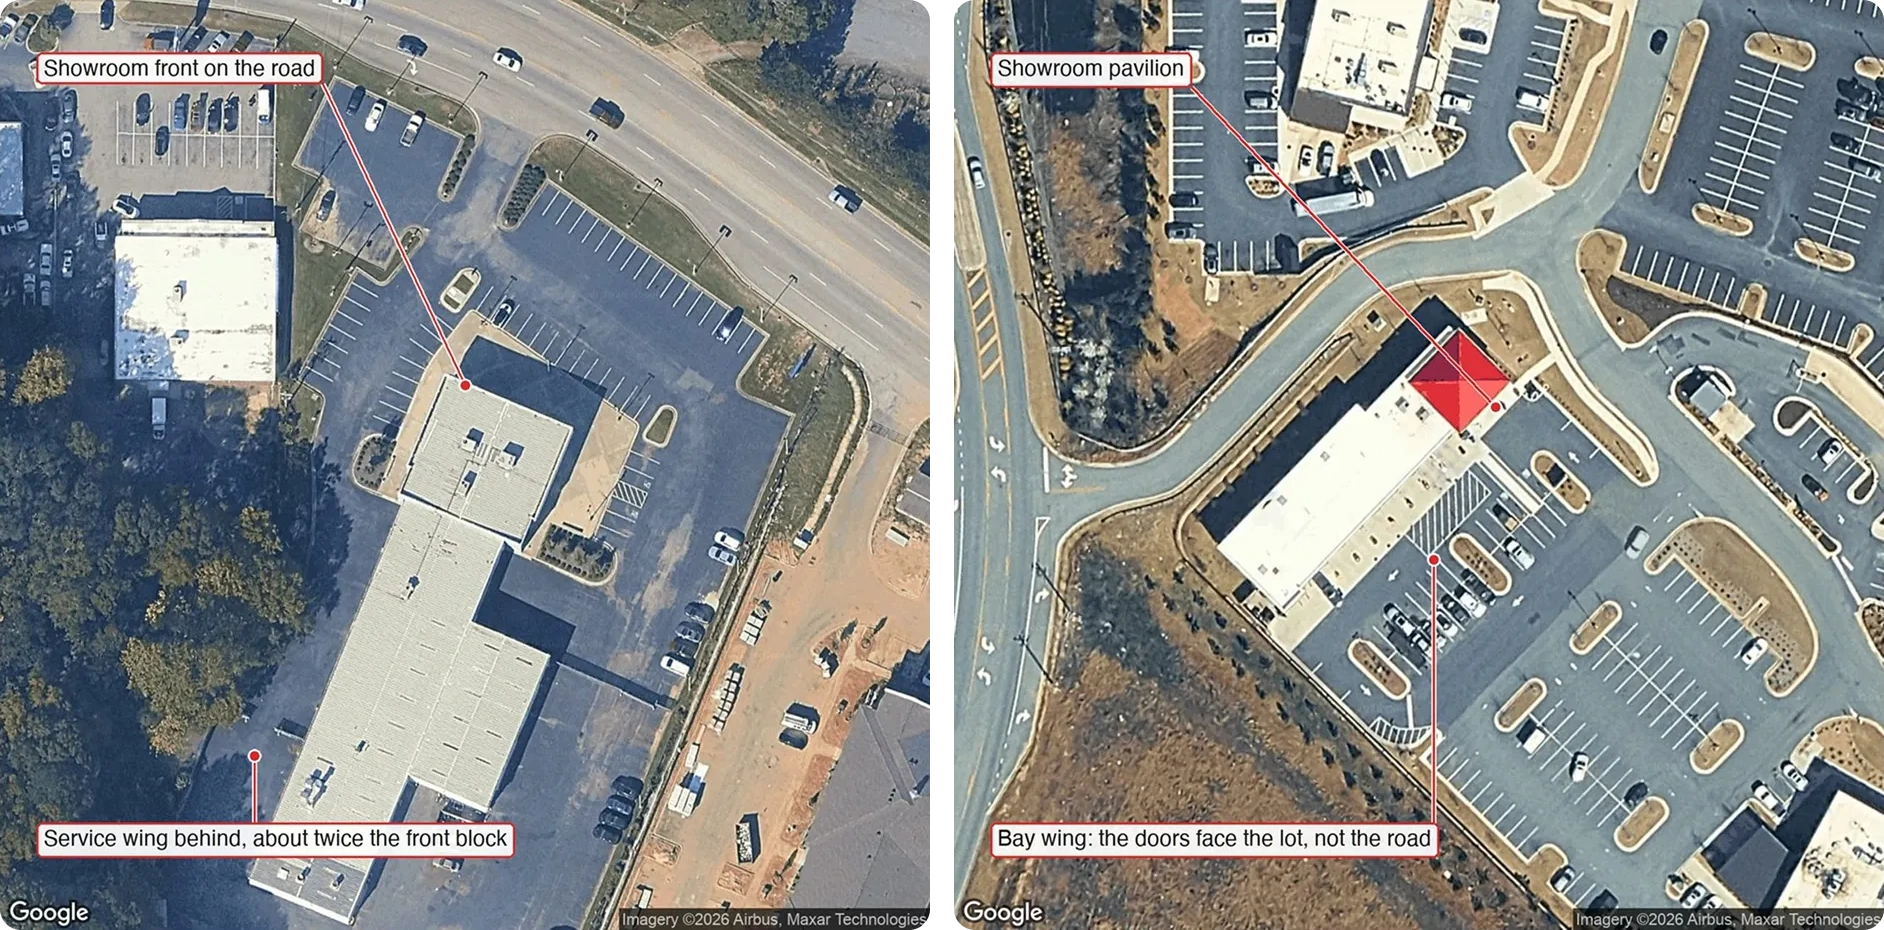
Building shapes carry meaning. On the left, a showroom front has a service wing behind it about twice the length of the front block, which is the layout of a converted dealership; from the road, this site shows a glass showroom and no door at all. On the right, a showroom pavilion has a bay wing whose doors face the lot, not the road; from the road, it shows a brick wall. Satellite imagery © Google, Airbus, Maxar Technologies.
The third job is the ground, not the roof. Painted arrows, lane markings, and the pattern of parked cars tell you how the building is used. A quick lube with lane arrows on both long sides is a drive-through: a car enters at one end and leaves at the other, so a door count of six means three positions, not six. The street-level camera sees a row of doors and cannot tell.
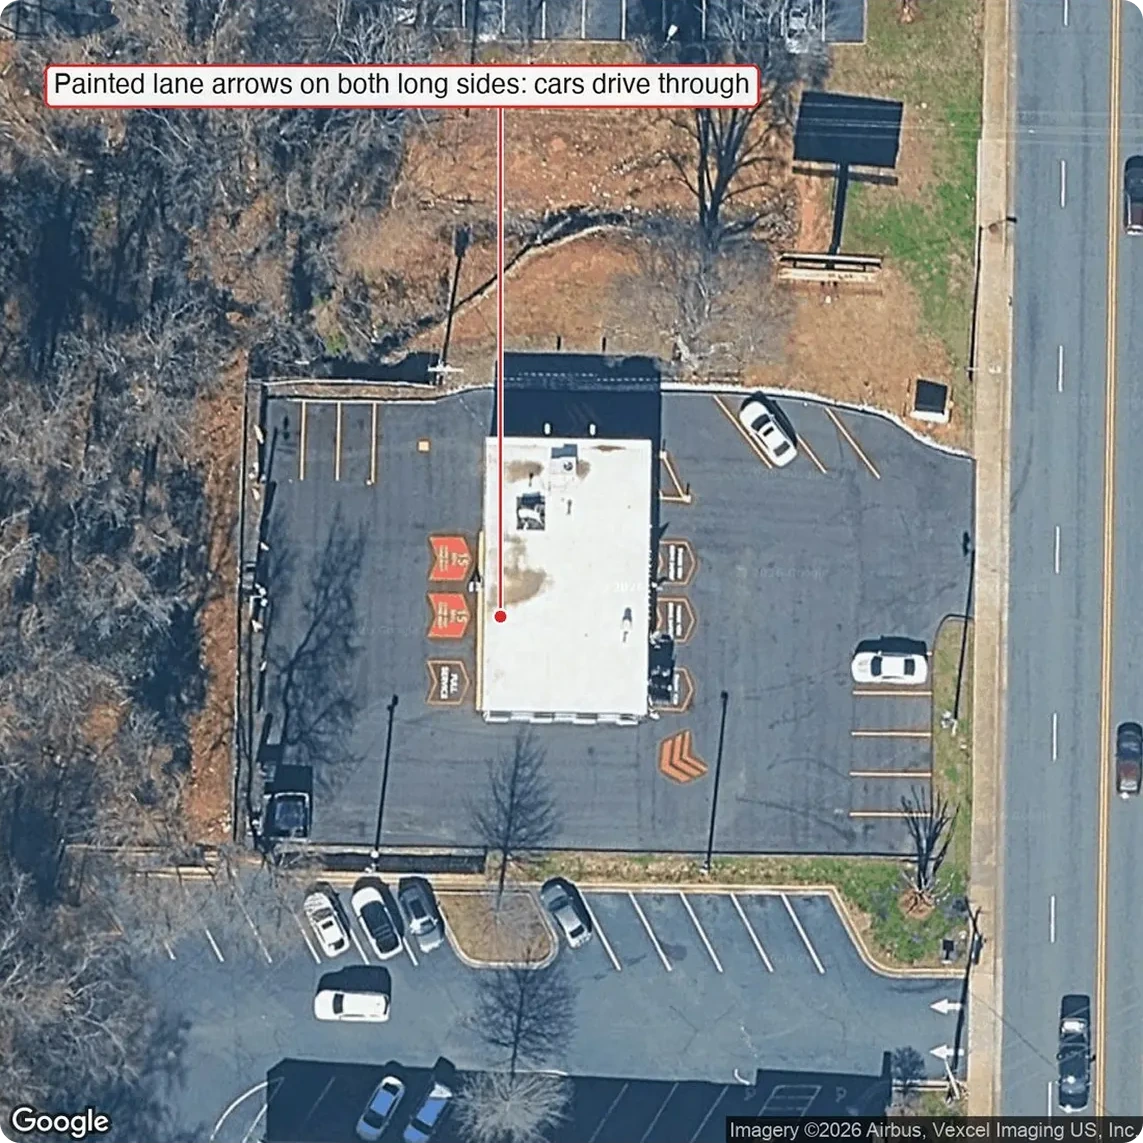
Seen from above, painted arrows on both sides of the building show that cars pass through it. The three doors on the street side are the entrances to three positions, and the three doors on the far side are the same positions seen from behind. Satellite imagery © Google, Airbus, Vexcel Imaging.
What the tile cannot do is just as important. It does not show the inside, so a roof that could hold ten positions may hold two lifts and a lot of storage. It does not know who owns which building, so the long shed at the back of the lot may be a neighbor’s. It is older or newer than the street-level frames by an unknown amount. And at the resolution a public tile offers, a skylight is a bright rectangle, not a count of bays. Every one of those limits is a reason to keep the other layers, and a reason the estimate is a range.
The limits make the tile a correction rather than a measurement, which is also how the people who use the number see it.
“For a sales team, the useful output of a satellite tile is not a bay count; it is a correction. A shop that shows two doors from the road and a long wing from above moves up the visit list, and that single change is worth more than any precision on the shops whose size was never in doubt.” — Oleg Boyko, CCO at GroupBWT
Rules for Interpreting Street-Level and Satellite Imagery
Most of what the two cameras can tell you comes down to rules that a person who has looked at a few hundred frames knows and nobody has written. We wrote them down while building the working prototype because a model follows written rules and rediscovers unwritten ones badly. A 2026 comparison of vision-language models with civil engineers and architects on Street View images found the same gap. The models reached about 70% average accuracy on construction type, current use, and story count and focused on visual indicators, while the experts also drew on context and domain knowledge.
- A frame under 12 kilobytes is the map service’s gray “no imagery” placeholder, the generic gray image described in the Street View Static API documentation. Drop it by size before anything looks at it.
- The panorama matched to the address is the façade shot. The nearest one is the detail shot. The ones along the road are for side walls. Do not let “nearest” mean “best.”
- A quick lube position is usually a pit in the floor, not a lift. A count of lifts that finds nothing is not a count of zero.
- A long service wing supports roughly one door per 3.5 to 4.5 meters of length. A count far below that contradicts the building and needs a reason.
- A satellite tile always shows the building, so it needs no check of whether it shows the business. Street-level frames and photos do.
- Nothing seen from above or from the road says who owns it. A shared building is a caveat that travels with the number.

How to Validate Imagery-Based Business Measurements
An estimate from imagery is useful only if it is right often enough to trust. We propose five checks before imagery-based business data enrichment runs on a full customer base, each aimed at a risk the prototype exposed. They belong to the wider work that our guide to data readiness for AI describes: knowing how far a dataset can be trusted before a model or a sales team acts on it.
Compare Against Known Locations
Start with a sample of locations where the answer is already known, such as shops a sales rep has visited, and compare the real capacity with the range the pipeline gave. This check catches misreadings that look plausible record by record. Examples are a drive-through counted as six positions instead of three, or a quick lube that works over pits counted as having none because no lifts were found. A true count should fall inside the range, and the range should not be so wide that it always does.
Track Source-Specific Errors
Each source fails in its own way, so errors should be logged by source rather than as one total. In our sample, the nearest panorama to one tire store was shot inside the showroom, a search along the road returned the inside of a neighbor’s workshop, and one tile showed a roof that may belong to the building next door. Logging errors by panorama role, by official or contributed capture, and by tile versus street frame shows which source deserves less weight and where a new check pays off.
Test Old vs Recent Imagery
Half the locations in our sample had panoramas from more than one date, which makes a simple test possible. Run the estimate on the older frames alone and on the newer frames alone, then compare the two. Agreement means the date matters little for that location. Disagreement is either a real change, like the lot that held boats in 2022 and trucks in 2024, or a sign that one view is too far or too old to read, like the 2018 and 2025 frames of the same repair shop.
Measure Confidence Calibration
Every estimate carries a confidence, and that confidence is useful only if it means what it says. Group the known-answer sample by the confidence the pipeline gave and compare how often each group was right. High-confidence estimates should be right far more often than low-confidence ones. The same test shows whether the confidence penalties for old frames, distant frames, and unseen walls are set correctly, or whether one of them weighs too much or too little.
Escalate Conflicting Cases
Some records need a person, not a better model. A shop whose door count and roof size disagree, a roof that may belong to a neighbor, and two dates that show different businesses all belong in a review queue rather than in the output. The estimate’s confidence and caveats should decide which records join the queue, so confident records stay out of it and the review stays small. GroupBWT applies the same restraint to customer records. In a Customer 360 project for a European bank, the matching routes low-confidence matches to a data steward instead of merging them.
What This Adds Up To
Two cameras that nobody pointed at your customers have photographed nearly every one of them, and between them, they describe a building well enough to size the business inside it. The craft is in not taking either picture at face value: choosing where the cameras stand, keeping the dates, treating the nearest panorama as a candidate rather than an answer, measuring the roof against the cars, and reading the lanes on the ground. Done that way, the two layers that exist for almost every address become the base of location intelligence about small businesses. The rarer layers, listing photos and websites, refine that base rather than replace it.
It varies with traffic. In our sample, about half the panoramas the pipeline used were captured in the last two years, and six locations in ten had a frame from the current or the previous year. One location in sixteen had nothing newer than 2019, and two rural addresses had nothing newer than 2008, which is why the capture date travels with every frame.
The nearest panorama can be years old or shot indoors. For one tire store, it showed a corridor inside the showroom. Our Street View data extraction step requests up to four panoramas per address and labels every frame with its distance, heading, capture date, and source, so that the model can weigh detail against recency.
A satellite tile shows the whole footprint: rear wings, yards, second buildings, lane markings, and parked vehicles. It cannot show the inside or who owns which building, so it refines the street-level count rather than replacing it.
You can, approximately. With a parked car as the ruler, a roof can be measured to within a few meters each way, which is enough to put a building in a capacity class and to catch a count that contradicts its size. It is not a survey, and the estimate is a range for that reason.
Every location in our sample that had coordinates had at least one panorama within about 170 meters, but a frame from that distance shows little, and rural coverage can be nearly two decades old. Where the street is blind, the satellite tile still shows the footprint and the lot, and the estimate says that the inside and the doors were not seen. Records with no street address at all, such as PO boxes, get no imagery until the identity step has placed them.
Read summarized version with
Build the Data Foundation Your AI Models Need
We develop and manage custom data solutions, powered by proven experts, to ensure the fastest delivery of structured data from sources of any size and complexity.
We offer:
- Custom Web Scraping & Development
- 15+ Years of Engineering Expertise
- AI-Driven Data Processing & Enrichment