
Read summarized version with



Image-based data enrichment is the process of deriving structured business attributes from visual sources such as street-level imagery, satellite images, listing photos, and websites. It is useful when important attributes, such as service bays, parking capacity, loading docks, or treatment rooms, are visible in the physical world but absent from commercial databases.
A layered method for business attributes that no database sells, shown on one of them: the number of service bays at small automotive businesses. AI is applied on top of the layers rather than instead of them. Written from a working prototype, with the numbers and the parts that went wrong.
Data Engineering: From Raw Web to
We develop and manage custom data solutions, powered by proven experts, to ensure the fastest delivery of structured data from sources of any size and complexity. We offer:
- Custom Web Scraping & Development
- 15+ Years of Engineering Expertise
- AI-Driven Data Processing & Enrichment
Most data enrichment quietly assumes that someone has already written down what you need. For large companies that holds. Small businesses break the assumption. In a sample of about a hundred automotive customers of a parts distributor, one in four had no website and one in three could not be found on Google Maps under their own name. An enrichment API returns an address, a phone number, a rating, nothing about how big the business is or how much it could buy from you.
And yet the small businesses that work from a physical location are not invisible. Each of them occupies a building that has been photographed from the road, from the air, and sometimes from the inside by its own customers. The information exists, in pixels rather than text. This article describes how we turn those pixels into a column in a table: a layered collection pipeline with AI applied on top of the layers rather than instead of them, written from a working prototype, the kind of early build GroupBWT delivers as an AI prototype development company. Three articles come out of that prototype, and this is the first. The second is about business entity resolution for customer lists, the step that ties each record to the right business before anything is measured.
Key Takeaways
- No single image source is reliable enough for physical business attributes: each layer has a blind spot, and a single source shifts every estimate in the same direction.
- Entity resolution should happen before any visual measurement, because a wrong match produces honest evidence about the wrong building.
- Cheap deterministic and text-based checks should run before expensive vision models; in the prototype, four records in ten had nothing to measure at all.
- The output should carry a range, a confidence score and a reference to the evidence alongside the point estimate.
- “Not applicable” and “not determined” should remain separate from zero, so that a missing or irrelevant reading never looks like a confirmed absence.
- The best validation metric for business attribute extraction depends on how the attribute will be used: a sales ranking can absorb small misses, but a large shop reported as small drops a top customer out of view.
Why the service bay count matters for business data enrichment
A distributor sells parts to several hundred thousand small automotive businesses across North America. Its stores sit close to repair shops so that a part arrives within the hour, and its sales teams decide every week which customers deserve a visit. Both decisions depend on how big each shop is, and the distributor does not know: its records hold purchase history and an address, nothing about the shop itself. The market behind those records is large: the U.S. Bureau of Labor Statistics counts 825,800 automotive service technician and mechanic jobs in 2025, a quarter of them in automotive repair and maintenance shops, and 15% of the workers are self-employed.
The best visible signal of size is the number of service bays: more bays, more cars on the floor, more parts bought. Nobody sells that number; today reps report it by hand for the major accounts, with no consistency and no refresh. Once it exists for every address it feeds sales prioritisation (the twenty-bay shop that buys like a five-bay shop), territory and store planning, cross-checks against purchase history, and a segmented customer base as a by-product.
The brief: a bay count per address, “in the ballpark” eight or nine times out of ten, and never wrong in the opposite direction. A 20-bay shop reported as 15 is a tolerable miss. Reported as 2, it drops a top customer to the bottom of a priority list, and nobody will check.
That asymmetry comes from how a sales team uses the list, not from anything in the model.
“Reps do not audit a ranking; they either trust it or work around it. One visible miss on an account they know well costs more trust than a hundred small misses they never notice, which is why the brief limits the direction of the error, not only its size.” — Oleg Boyko, CCO at GroupBWT
The same problem shows up everywhere in B2B data: checkout lanes, loading docks, treatment rooms, salon chairs, parking spaces. Distributors, franchisors, lenders and insurers size small businesses by attributes like these, and in every case the attribute is physical, visible, and absent from every database you can buy.
Why one source is never enough
The instinct is to pick the best source and go. Street View covers nearly every address, and in our sample every record we could place on a map had a panorama within reach. Run the addresses through it alone and the errors are not random. They lean in one direction.
Street-level imagery sees the façade and nothing else. One tire shop shows two roll-up doors from the highway. The satellite shows a service wing behind the showroom, as large as the front building, with six skylights in two rows. A façade count says two. The roof suggests more, but six skylights are a reason to estimate higher, not proof of six work positions.
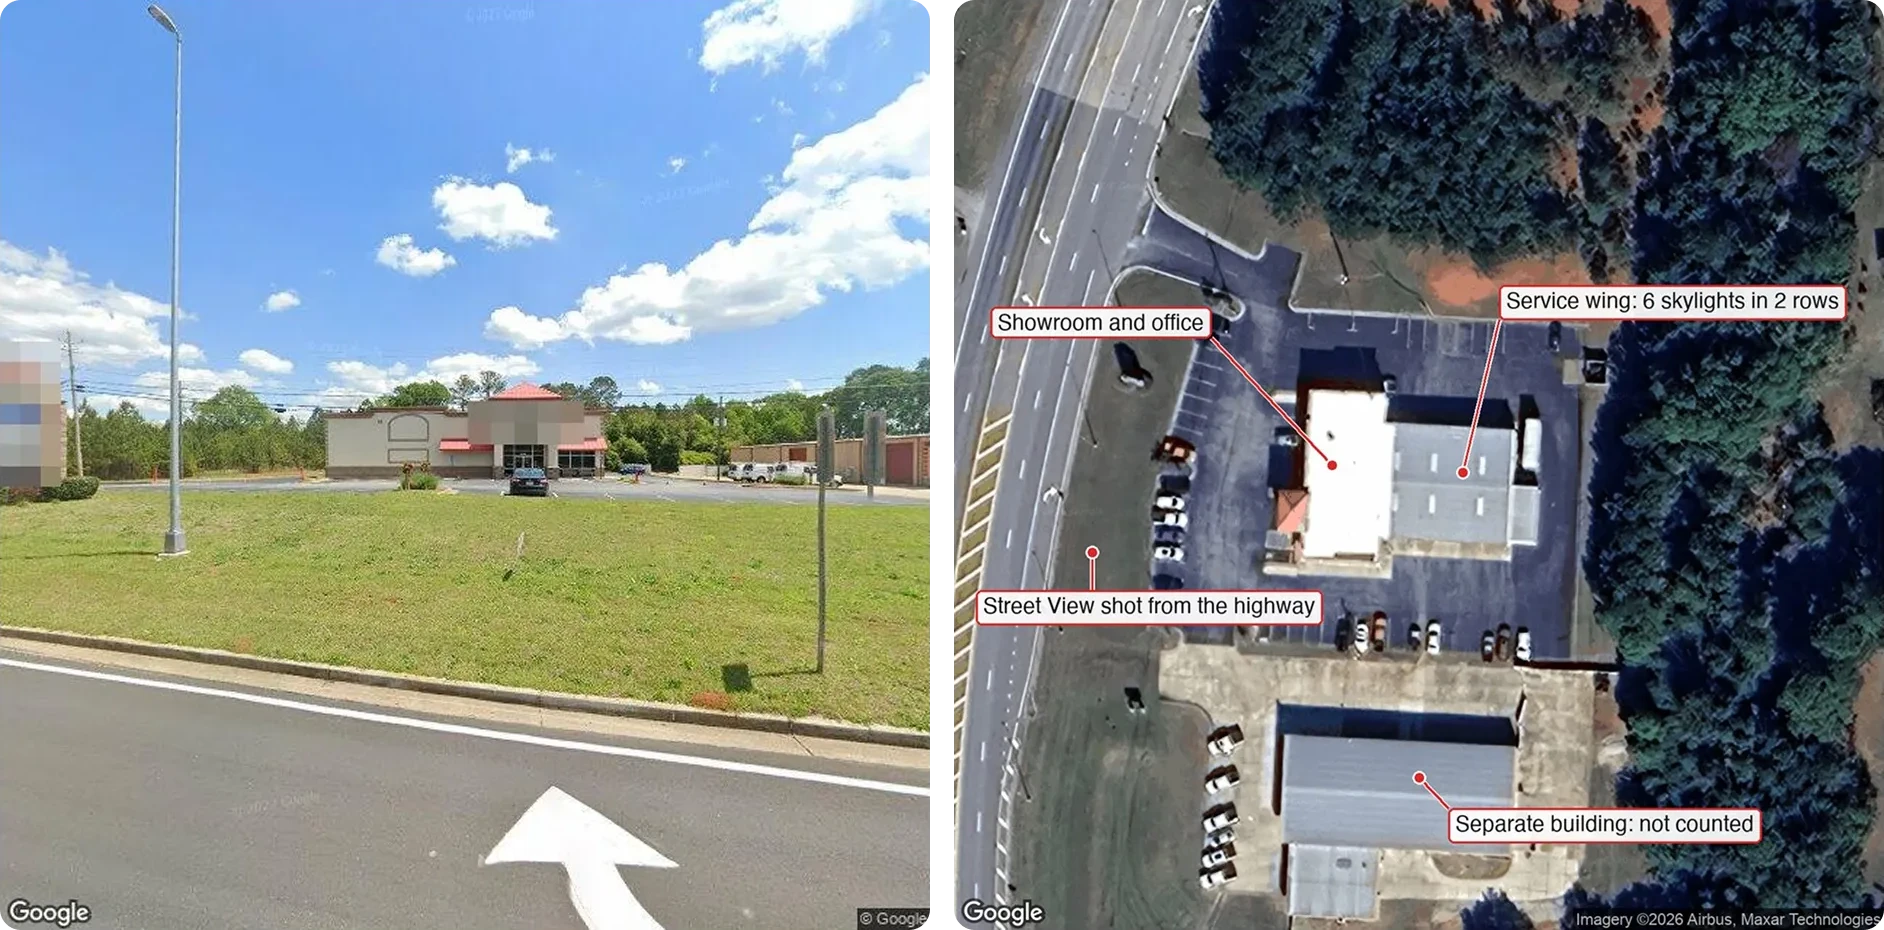
The same tire shop from the highway and from above. The street sees a showroom front; the satellite sees a service wing as large as the showroom. The street-level count was two; the combined estimate became six, in a range of four to eight. Imagery © Google; satellite imagery © Airbus, Maxar Technologies. Signage pixelated.
Satellite imagery has the opposite bias. It shows the full footprint but cannot tell a working bay from a storage shed, or who owns the building at the back of the lot. Street-level imagery is also old, unevenly. Captures in our sample were dated between 2008 and 2026, and in one case the newest frame showed the previous tenant, a boat yard. The pipeline keeps the capture date on every frame.
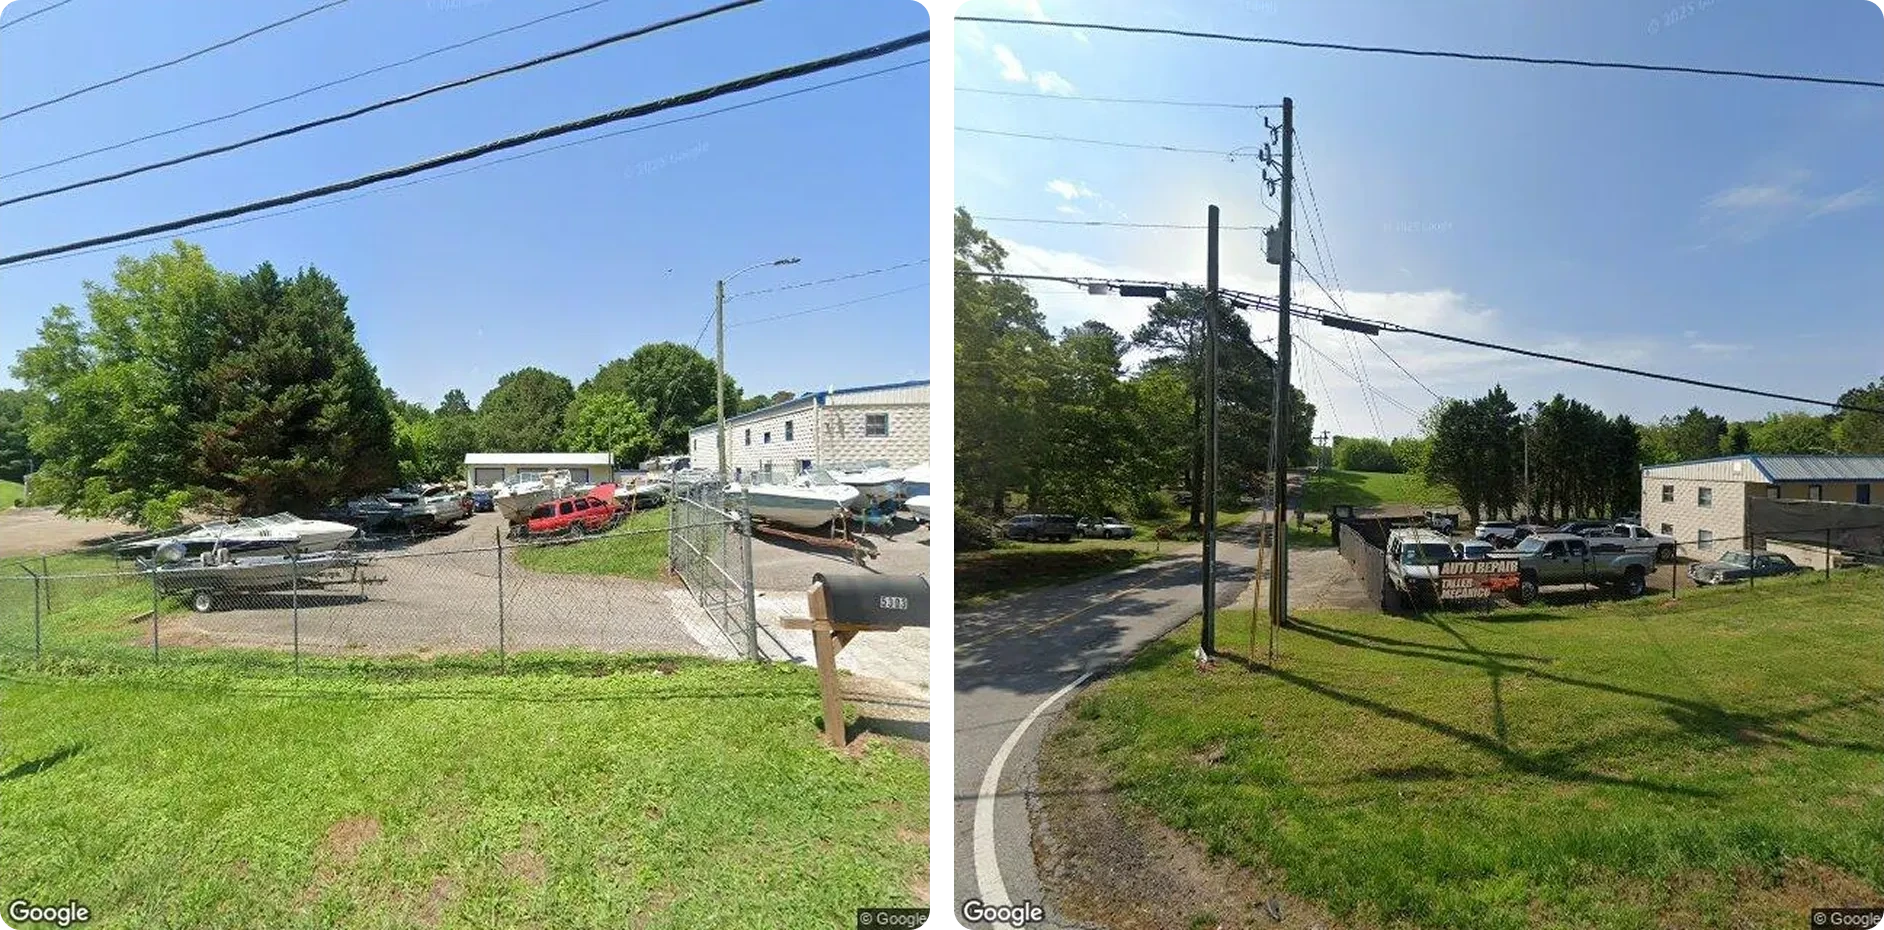
Same address, 22 months apart. In June 2022 the lot held boats. By April 2024 a banner reads “auto repair” and the yard holds trucks. A pipeline that takes the nearest frame and stops would have measured a boat yard. Imagery © Google.
A business website is a marketing document. Of the shops with a site of their own, exactly zero stated how many bays they had, and several showed photos of other branches. Customer photos are the only source that reaches inside, but they exist only where customers bothered to take them; interior positions could be counted for four records in ten.
In image data enrichment, a single source produces a systematic shift, not noise, and averaging more records never cancels it out. Layers combine sources whose blind spots do not overlap.
Data sources for image-based enrichment: what each layer shows and misses
Each layer is collected independently and returns its own observation with a reference to its evidence. None of them is allowed to be “the answer”. GroupBWT built the same principle into a custom data lake for external market signals for a global analytics team: the raw zone keeps an exact snapshot of every source, so analysts can audit a decision later without collecting the data again.
| Layer | What it shows | Blind spot |
| Street-level panoramas | doors, gates, signage, vehicles; several capture dates | nothing behind the façade; age varies |
| Satellite tiles | footprint, rear wings, yards, second buildings | the inside; who owns which building |
| Listing photos and reviews | the inside: lifts, pits, work positions; review volume | only where customers post |
| The business website | gallery, services, occasionally a size statement | marketing copy; other branches; stock images |
| Open web | directories, registries, local news | thin per record |
Street-level panoramas. One frontal shot is not enough, because buildings sit back from the road and the detail is often on the side. So for each location we pull several panoramas along the road and aim several frames at the building from each; where a location has panoramas from more than one date, the difference between them is a change signal. The third article in the series, on Street View and satellite imagery analysis, shows how those panoramas are picked, dated and checked.
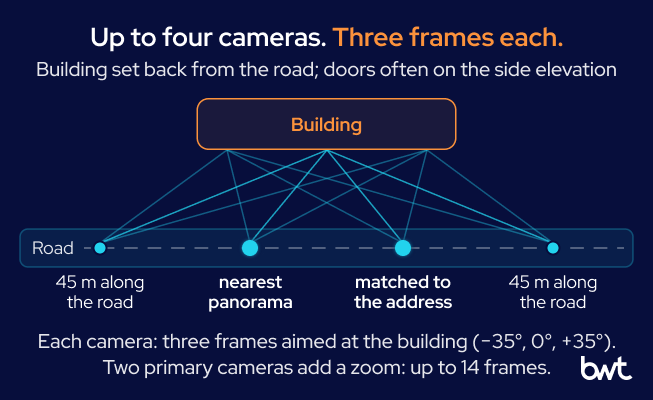
How the street-level layer is shot. Up to four panoramas along the road, each with three frames fanned across the building, so that a door on the side elevation has a chance to appear in at least one frame.
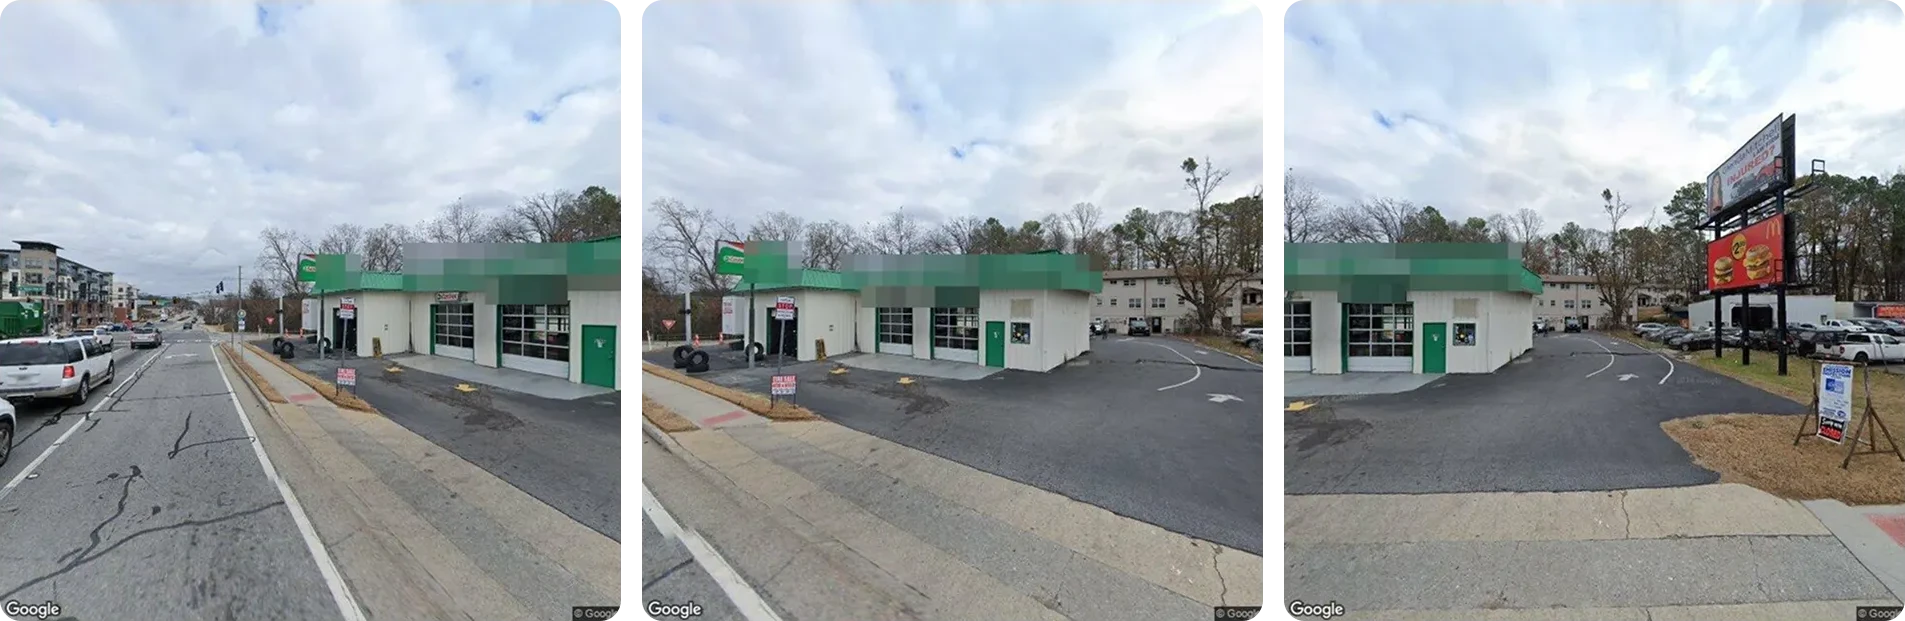
Three frames from one panorama: 35 degrees left, straight on, 35 degrees right. Only the middle frame shows both bay doors; the right frame shows the exit lane that reveals the bays are drive-through. Imagery © Google. Signage pixelated.
Satellite tiles. They catch the full footprint, a rear wing, a second structure, and a parked car in view gives the model a ruler for the roof. They never show what is inside.
Listing photos and reviews. Customer photos are the only practical way inside a small business at scale, where lifts, racks and pits become countable. Reviews add an indirect signal: 1,200 reviews naming several technicians suggest a shop larger than a two-bay façade. That is a reason to look for more bays in the other layers, not proof that they exist.
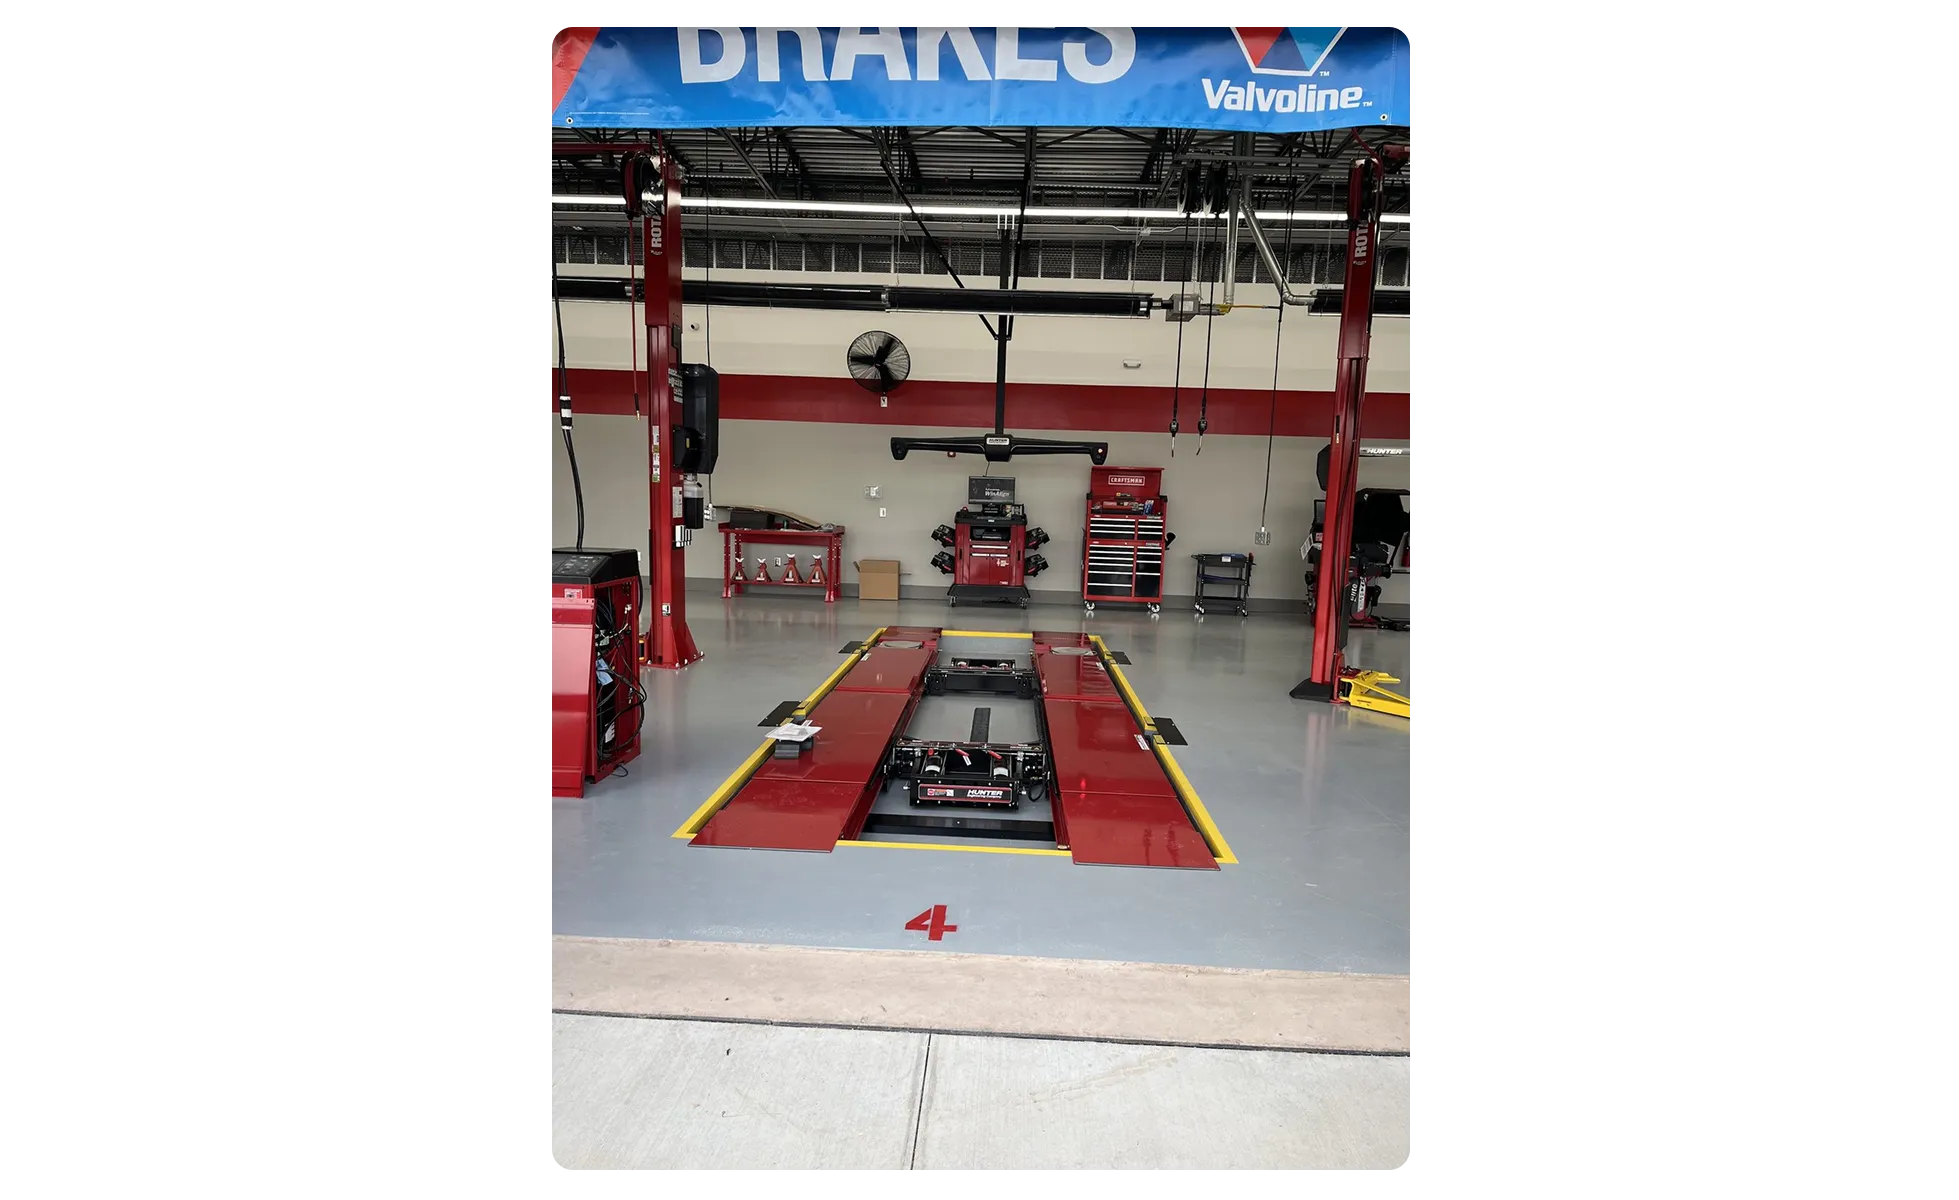
The only layer that reaches inside. A listing photo of bay number four: an alignment rack, a two-post lift on either side, tyre equipment at the edges. From the road this is one of eight identical arched openings; from inside it is a specific work position with specific equipment. Photo from the business’s Google listing.
The business website. Where the listing has none, a web search runs and a model picks the shop’s own site out of the directory noise. Crawling is ordinary scraping work: sitemaps or a link walk, caps per site, galleries before blog posts. Whatever the site says is recorded as a quoted claim, never as a measurement.
Open web. Directories, registries, local news. Thin per record, but for one record in five it was the only evidence the business existed. Commercial real-estate listings and industry codes (NAICS, SIC) are worth adding; which layers belong in your pipeline depends on the decision the data feeds.
Image-based data enrichment pipeline architecture
Handing everything to one large multimodal call produces an answer, not a defensible one. We run a chain of specialised steps and match the model to the difficulty of each.
Our prototype deliberately ran every layer on every record, which is right for a hundred records and wrong for three hundred thousand, because imagery retrieval, vision-model calls and crawling are charged per record. The full run showed where the money goes. The website layer took more time than the other four layers combined, and the triage step kept only 8 percent of its images. Four records in ten (fleet garages, institutions, non-automotive businesses, mobile mechanics, used-car lots) had nothing to measure at all.
So the layers should run as a cascade with early exit:
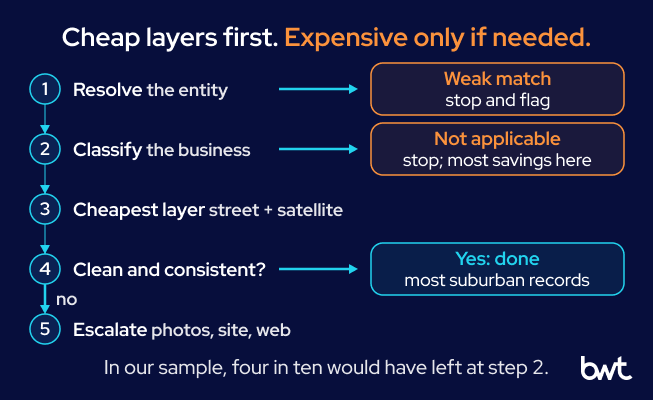
The cascade. Expensive layers run only for records that survive the cheap ones and still lack a confident answer.
- Resolve the entity; if the match is weak, stop and return “not determined” with the reason.
- Classify the business; if the attribute does not apply, mark the record “not applicable” and stop. Most of the savings live here.
- Run the cheapest informative layer: street level plus satellite.
- If the observation is clean and consistent, you are done. Most suburban records end here.
- Otherwise escalate: more panoramas, interior photos, the website, the open web.
Entity resolution
Before any measurement, one step decides whether the rest is worth running: matching the record in your list to the actual place on the map. Lock onto the wrong building and every layer collects honest evidence about it; unless a later step notices the mismatch, the answer comes back wrong with high confidence.
The customer list is a billing system’s view of the world: names carry route codes and payment terms, some addresses are PO boxes, and some records are mobile mechanics with no building at all. Google’s own pin is not always the building either; in our sample one pin landed on a county courthouse and another on the centre of a ZIP code.
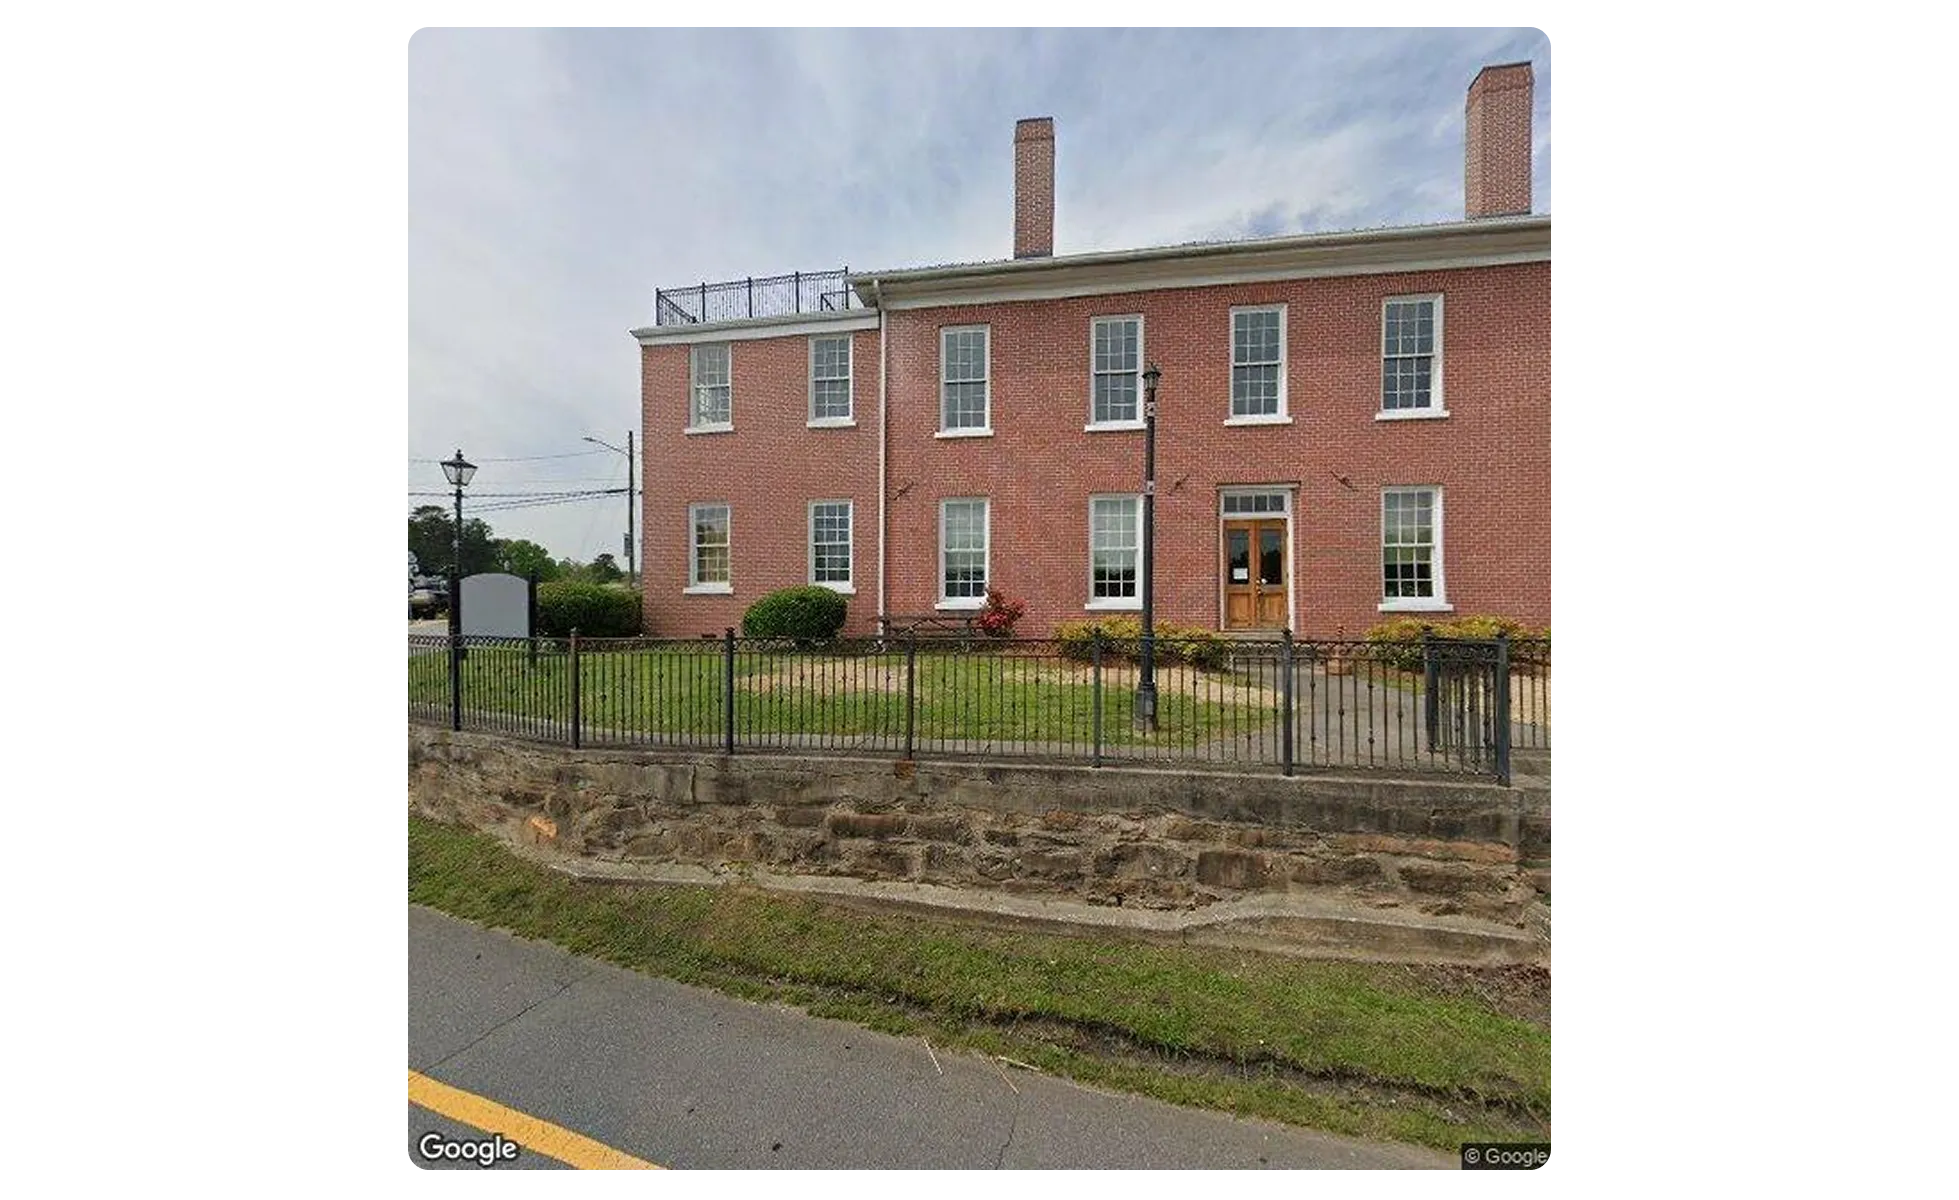
Where the pin landed. Google’s point for one customer’s address is the county courthouse. Every frame collected here would have been honest evidence about the wrong building. The measurement step caught it, when the model reading the frames saw a courthouse instead of a shop, and flagged the record. Imagery © Google.
A pin on a courthouse is at least easy to spot once someone looks at the frame; in the prototype that happened only at the measurement step, after the imagery had been collected. The matches that slip through are quieter.
“The dangerous matches are not the hard ones, which get escalated anyway. They are the easy-looking ones: a confident hit on a shared word, or a pin that lands on a real building that happens to be the wrong one. A matching step earns its place by recording why it accepted each record, so that a reviewer can undo the decision later.” — Alex Yudin, Head of Data Engineering at GroupBWT
So we search for each record in several ways and let a model, not a string-matching rule, read the results, with a stronger model as a second opinion on anything short of a confident match. The answer is one of five verdicts, from “confirmed” for about half the sample to “not found” for about one record in ten, each with a note that the later layers read before they start. Shared buildings are flagged at this step too, because a neighbour’s bays must never be attributed to your record. The second article in the series covers the record clean-up, the string rule that failed, the five verdicts and the check that catches a wrong pin before any picture is fetched.
Business classification
Classification comes before measurement. Next to repair shops we found a high school, a hospital, a post office and city governments: genuine customers for whom a bay count does not apply. The output should mark them “not applicable”, not zero. The identity step, three map searches and one or two cheap text-model calls, had already put nine records in ten into a business type before a single picture was looked at, so for most records this gate needs no imagery.
Street-level and satellite collection
The cheapest informative layer is street-level imagery analysis combined with a satellite tile of the same lot, both taken at the resolved location rather than at the billing address. This is where geospatial data enrichment starts: the panoramas carry their capture dates, the tile shows the footprint behind the façade, and together they are enough for a first observation, which is why the cascade tries them before anything else.
Image triage
Computer vision for data enrichment does two jobs in this pipeline, and they need different models. Triage is the first: a mid-size vision model looks at every picture, six at a time, and decides only whether it shows the service facility. A polished, anonymous workshop photo with no signage is a stock image; when in doubt, keep the picture. About one picture in four went through.
Deterministic logic belongs in code, not in the model: stripping store codes from names, normalising addresses, de-duplicating images by hash, routing satellite tiles past triage. All of it is the ordinary work of a data engineering service provider, costs a thousandth of a model call, and is what makes a prototype affordable to run.

Multi-source observation
The strongest model gets one call per record with everything that survived, up to 40 pictures, interiors first, and returns a structured answer: external doors and interior positions with confidences, the website claim, the estimate with its range and confidence, a data-quality grade, flags, a written rationale, and the pictures a reviewer should open first. The answer is recorded with its inputs, each identified by source, so that any estimate can be audited.
The order of the steps is also a cost decision.
“The strongest model is the slowest and the most expensive part of the chain, so it should see each record once, with only the pictures that survived triage. Called per picture, it is paid to answer the same question many times; called before the cheap filters, it is paid to look at parking lots and stock photos.” — Dmytro Naumenko, CTO at GroupBWT
One rule matters more than the architecture: steps must not inherit each other’s conclusions. The final model is told that triage notes are hints, not ground truth, because an arbiter who knows an earlier step said four will find a way to agree with four. Research on street-level imagery found the same pull: in a 2026 arXiv study of vision-language models for urban sensing, when images and records disagreed, predictions usually moved towards the supplied record. In the first run the triage counted five to seven doors on a new tire store from oblique frames; the final model found the straight-on gallery photo, counted eight, and wrote down why the triage had been low.
Confidence and arbitration
Disagreement is the most informative thing the pipeline produces. The canonical case is a repair shop in a converted industrial building. Street View shows a row of glass roll-up doors, five or six in frame and more cut off, never the whole row in one picture. The satellite shows the wing is about 50 metres long, which at 3.5 to 4.5 metres per door leaves room for 10 to 12. Street level says six, satellite says twelve, and neither is wrong.
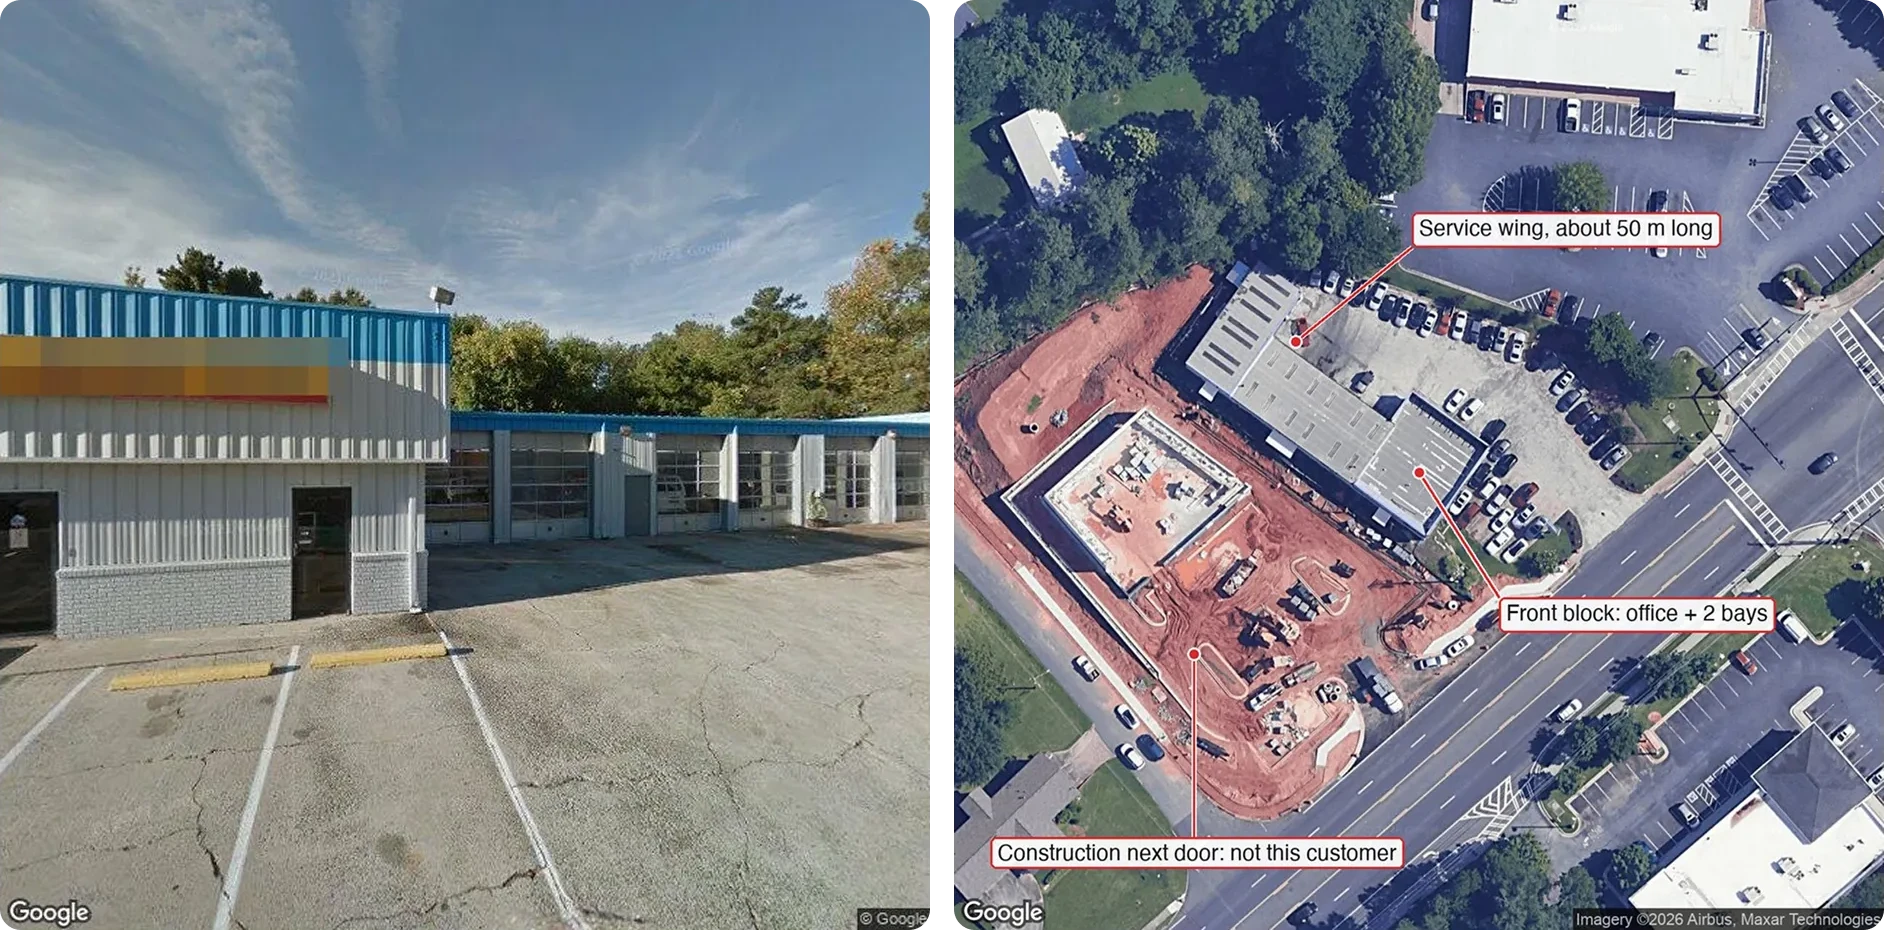
Left, the 2018 frame: the door row runs out of the picture. Right, the satellite: the wing is about 50 metres long, and the doors face the parking lot, not the road. The pipeline returned 12 in a range of 8 to 16. Imagery © Google; satellite imagery © Airbus, Maxar Technologies.
The correct output is a range with a most likely value inside it: here 12, in a range of 8 to 16, with a note that a lower figure would contradict the length of the building. Every estimate therefore carries the value as range and point, a confidence score, and a reference to the frame or page that drove it. The one column the client asked for became a dozen:
| Field | Value |
| External bay doors | 7 · confidence 0.60 · evidence: Street View frame 14 (2018, side view), satellite tile |
| Interior positions | 2 · confidence 0.40 · evidence: listing photos 3 and 7, two-post lifts |
| Estimated bays | 12, range 8 to 16 · confidence 0.55 · data quality: partial |
| Rationale | A 50 m wing with a continuous row of roll-up doors supports 10 to 12 at 3.5 to 4.5 m per door; the front block adds two. Indoor photos confirm two-post lifts. A figure below about 8 would contradict the building length. |
Human review and delivery
Every number should be checkable by eye in under ten seconds, so the prototype has a review screen with the model’s reasoning beside links to the frames, tiles, photos and pages behind each row. A number that cannot be checked that way will not be trusted, however accurate it is. Low-confidence records should reach that screen first; the validation run described below decides where that line sits.
Delivery is a flat row per record, loaded into the client’s warehouse alongside whatever location intelligence it already holds, or pushed into the CRM so the sales rep sees the attribute next to the account, which is usually where the value actually lands.
GroupBWT’s product-matching architecture for retail catalogs follows the same principle: each match carries a confidence score and a short reason, and low-confidence pairs go to an analyst review queue.
Why the pipeline reports confidence, not just a number
A pipeline that always returns a number is not more capable. It is less honest. In our sample only a third of the estimates had a confidence of 0.7 or higher, for specific reasons:
- No view of the inside. More than half the records had no usable interior picture.
- Residential addresses and shared buildings. One record in five pointed at a house, one in ten at a multi-tenant structure.
- Things that are bays but do not look like bays. Quick-lube shops work over pits, not lifts; drive-through bays have a door at each end. Both needed a written rule.
- The right business, the wrong building. One municipal customer resolved to the town hall. The prototype measured every record, so it counted the doors there and returned a low-confidence 3 with the address to check next. That 3 is not a valid result: in the cascade, the classification step marks a city government “not applicable” before any door is counted, and the record carries no bay number at all.
Things that are bays but do not look like bays. Left: a quick-lube from above, where cars enter at the front and leave at the back, so four doors mean two positions. Right: inside such a shop the position is a pit, not a lift. Satellite imagery © Google, Airbus. Interior photo from the business’s Google listing.
An empty result beats an invented one. Where no bays are reported, a record ends in one of three states, and the output keeps them apart:
- 0: the building is identified, and the evidence shows that it has no service bays.
- “Not applicable”: the attribute does not fit the customer, such as a school, a post office or a mechanic who works from a van.
- “Not determined”: the evidence does not support a reading, and the record carries a reason code.
In the prototype nearly a third of the records came back as zero although the question did not fit them; in the output they belong under “not applicable”, because a missing or irrelevant reading must never look like a confirmed absence of bays.
How to validate image-based data enrichment
We will not quote an accuracy percentage for this kind of system, and we would be sceptical of anyone who does so before a blind test. Here is the protocol we propose for visual data enrichment instead. It is cheap and takes about a week.
Build a ground-truth sample
The client selects the test set: records where they already hold ground truth, from field reps or store managers. The sample should hold between 150 and 300 records, deliberately mixed across urban, suburban and rural locations, because coverage differs radically between them and a city-only sample will flatter the system. The run should be blind, with no access to the client’s numbers before it.
Measure tolerance-band accuracy
The first metric is the hit rate within a tolerance band. The client defines what deviation is acceptable for their decision, because the answer depends on the decision, not on the data. For the distributor’s sales ranking, the band is the “ballpark” from the brief quoted at the start, and that eight-or-nine-in-ten figure is the client’s target for the validation run, not a result the prototype has shown.
Track inverse errors separately
Inverse errors are a different class of error. Reporting 15 for a 20-bay business is a tolerable miss; reporting 2 buries a top customer. Mixing both into a single accuracy percentage hides the only error that actually costs money. We track inverse errors separately, with a target of zero, and treat the count as a gate rather than a score. Entity-resolution teams treat matching errors the same way: AWS’s guide to measuring matching accuracy scores false matches and missed matches as separate measures, against a manually annotated ground truth set.
We wrote the asymmetry into the final model’s instructions, and it shows in the rationales: for the industrial building above, the model widened its range upward and noted that the choice “avoids a directionally small answer”.
Test confidence calibration
The third metric is calibration: whether confidence tracks correctness. When the system is right, it should be confident; when it is wrong, confidence should fall. This is the metric almost nobody measures, and the one that determines whether the output can be weighted inside a downstream model.
Our prototype run shows the raw material for this test. Besides the third of estimates at 0.7 or higher, another third fell between 0.5 and 0.7, a quarter between 0.3 and 0.5, and a few below 0.3. If the top band is right nearly every time and the bottom band is wrong most of the time, the confidence score means something and can drive automation. If accuracy is flat across the bands, the score is decoration, however good the average looks.
Review low-confidence cases
After the run, the thresholds should be set from the results: which confidence band can be trusted unreviewed, which needs sampling, and which goes to a person or is dropped. Records marked “not determined” belong in the same review. Their reason codes work as a roadmap: they show which additional source would close the gap, and whether it is worth buying.
Reviewing those cases is also how counting rules get written. Beyond the drive-through and quick-lube rules above, the prototype run needed written rules for a paint booth (a position, not a lift), a chain website full of photos from other branches, a listing marked closed whose building is still a shop under a new name, and a neighbour’s doors in a shared building. A production system should hold each of those as a rule, not as something the model rediscovers for every record.
That is the real deliverable of a validation run. The value is not a number on a slide. It is knowing where the automation boundary sits.
Also Read: Ready Made Datasets vs Custom: What Enterprise Teams Must Know Before Choosing
From imagery to structured business data
Nobody had written down how many bays these shops have, and no database sells the number. But the information was there: in street-level frames, satellite tiles, listing photos, websites and the open web, each showing one part of the building and hiding another. Collecting those layers independently, confirming the identity of the business first, running the cheap layers before the expensive ones, and letting a chain of models observe and arbitrate rather than guess turns pixels into a column in a table: a value, a range, a confidence and a reference to the evidence for every address. That is what layered collection is for: information that exists but does not lie on the surface, about businesses that no enrichment API describes.
No. Every observation comes from publicly accessible imagery and text. A field visit is useful only as ground truth for the validation run.
We do not quote a percentage before a blind test. The useful measures are the hit rate within your tolerance band, the count of inverse errors, and whether confidence tracks correctness.
One row per address with the estimate, its range and confidence (or a “not applicable” or “not determined” status with its reason), counts per source, flags, a rationale and evidence references, delivered as a file, into your warehouse or into the CRM. We need names and addresses; store codes and coordinates improve matching, and any counts you already hold become the validation set.
The layers are the same for any physical, visible attribute: loading docks, checkout lanes, treatment rooms, parking. What changes is the classification step and the counting rules.
Street-level imagery is re-captured years apart, so a yearly re-run plus targeted re-runs for flagged records is the useful cadence.
Read summarized version with
Tech Stack
Data Engineering: From Raw Web to
We develop and manage custom data solutions, powered by proven experts, to ensure the fastest delivery of structured data from sources of any size and complexity. We offer:
- Custom Web Scraping & Development
- 15+ Years of Engineering Expertise
- AI-Driven Data Processing & Enrichment