
Read summarized version with


The invoice rose again, yet the platform completed roughly the same work. Databricks cost optimization starts by separating the cost category, tracing the increase to a workload, and testing one likely cause. A lower invoice counts only when useful output holds and service quality stays within agreed targets.
A bill can fall because a report refreshed late, a job processed less data, or lower infrastructure spend created more manual recovery work. Measure cost per useful completed unit of work beside runtime, freshness, queue time, and failure rate.
Related Data Services
Review Databricks CostAgainst Real Workloads
GroupBWT reviews billing records, workload behavior, ownership, and service targets before recommending changes.
You receive:
- A comparable cost baseline
- Owner-mapped findings and safe first actions
- Cost, runtime, freshness & reliability checks
What to Do Before You Cut Databricks Spend
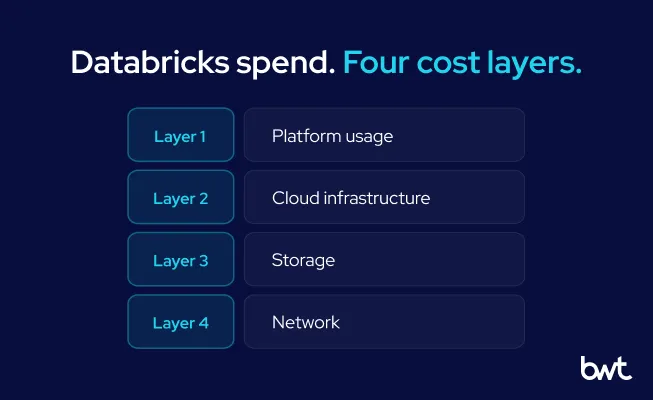
- Separate Databricks usage charges from cloud-provider-billed infrastructure, storage, and network costs before comparing classic and serverless compute. For serverless, the underlying compute infrastructure is Databricks-managed rather than billed as separate customer-managed VM charges.
- Trace the increase to a workload, owner, and useful output before changing capacity.
- Evaluate Databricks-specific levers such as serverless, Photon, and liquid clustering against equivalent completed work and service targets.
- A GroupBWT cost audit traces cost drivers, ranks reversible fixes, and gives each test a validation window. The result is an engineering remediation plan, not a generic recommendation to shrink clusters.
Before asking how to optimize Databricks costs, identify which part of the bill moved. Compare periods with equivalent demand: month-end close against month-end close, not a quiet week. Choose a meaningful unit of completed work such as a non-redundant successful job run, refreshed table, served query, or completed model run.
Total Databricks-related spend can include Databricks platform usage, cloud infrastructure for classic compute, storage, and network or data-transfer charges. Serverless compute changes how some of those costs are billed rather than adding a separate cost category. The compute model, cloud provider, product, network configuration, storage model, and commercial terms determine where charges appear and how they are priced.
| Cost layer | What it includes | First diagnostic question |
| Databricks platform usage | DBUs and other SKU-metered Databricks usage | Which product and workload consumed more units? |
| Classic cloud infrastructure | VMs, disks, and relevant network costs billed by AWS, Azure, or Google Cloud | Did capacity or active time rise? |
| Storage and data access | Object storage, retention, and default storage where applicable | Did data grow, or did cleanup stop? |
| Network and data transfer | Cross-region traffic, egress, and private connectivity where applicable | Did architecture or product use change? |
For serverless compute, VM infrastructure is included in the Databricks DBU charge. External storage and some networking or data-transfer charges can still be billed separately from the compute charge. Classic compute infrastructure is billed separately by the cloud provider, so comparing only Databricks usage charges can distort a classic-versus-serverless decision.
The Databricks billable usage system table records usage quantity, unit, SKU, product origin, workspace, identity, tags, and available workload metadata. Retractions and restatements correct earlier records, so aggregate usage rather than removing those record types. Join the applicable price window from the Databricks list price table when effective list-price cost is the comparison basis.
Pick one denominator per workload. For a nightly job, cost per successful run can work when each run produces one required business output. For a SQL warehouse, compare cost per query within a comparable query class, alongside business-hour demand and queue time.
“A bill is an output, not a diagnosis. If the team cannot name the workload, owner, completed unit, and service target behind a cost line, a cheaper configuration is still a guess.” — Dmytro Naumenko, CTO at GroupBWT
Databricks Cost Optimization Best Practices
Use these principles as a decision order rather than a list of isolated savings tactics:
- Attribute spend to a workload and owner before resizing compute.
- Remove unnecessary work before tuning the work that remains.
- Benchmark changes against equivalent useful output and service targets.
- Optimize workload design before reducing compute capacity.
- Assign one accountable owner to every material finding.
- Automate reversible controls before approval-gated production changes.
- Verify unit economics, not only the total invoice.
Rising Databricks Spend Leaves a Workload Fingerprint
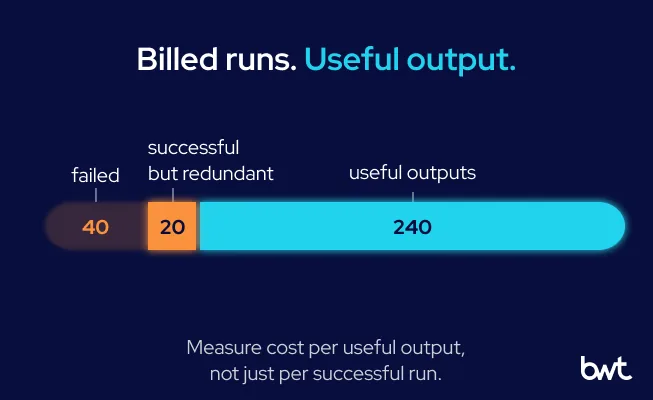
Stable volume can hide more work. Retries can repeat work, schedules can create duplicate runs, and fragmented files can increase scan overhead for the same output.
Cost optimization in Databricks becomes an engineering investigation when you compare active compute time, compute size or worker shape where configurable, run frequency, failures, bytes processed, queue time, and useful output. Use those signals to narrow the cause, then start with a test you can reverse safely.
| Symptom and evidence | Possible cause | Safe first check | Resulting decision |
| Active time rises; output is flat | Idle window or longer-lived compute | Plot usage by hour against activity | Test a shorter inactivity window on one non-critical resource |
| Run count rises; source volume is flat | Schedule drift or overlapping triggers | Compare scheduler history with required freshness | Remove one duplicate trigger and observe a full cycle |
| Failures and retries rise together | Data or code regression | Group failures by task and input boundary | Fix the recurring fault before resizing compute |
| Queue time rises at peak | Shared-capacity contention | Separate queued demand by workload | Test scaling or workload isolation if contention recurs |
| Bytes scanned rise per query | Layout or query change | Compare plans and touched data | Test the change on a bounded sample |
| Storage grows faster than the data the business needs to retain | Duplicate copies or stale retention | Check age, ownership, and downstream use | Delete only after owner and recovery checks |
A worked first audit
This hypothetical audit shows the calculation; it does not report a client result. The baseline contains 300 billed runs: 260 technically successful runs, including 20 redundant runs, and 40 failed runs. The remaining 240 successful runs produce useful outputs. Databricks usage at effective list price across all 300 billed runs is 1,200 illustrative cost units.
Use this sequence for a first audit:
- Define the reporting window and one useful-output measure.
- Select each run’s latest known terminal state, then assign it to the period in which that state occurred.
- Join those
run_idvalues to billing usage and the applicable list-price window. - Classify successful but redundant runs from schedule history and business rules.
- Compare cost per technical success with cost per useful output before approving a change.
The business result comes first:
| Period | Billed runs | Technical successes | Useful outputs |
| Baseline | 300 | 260 | 240 |
| After trigger removal | 280 | 240 | 240 |
| Period | Failed runs | Redundant runs | Databricks usage effective list-price cost |
| Baseline | 40 | 20 | 1,200 |
| After trigger removal | 40 | 0 | 1,120 |
Cost per useful output is 5.00 in the baseline and 4.67 after trigger removal. Remove one duplicate schedule, and 20 billed runs plus 80 cost units disappear. The 40 failures and 240 useful outputs stay unchanged. Databricks usage cost at effective list price drops by about 6.7%.
The technical-success metric tells a different story. Because redundant runs previously counted as successes, this metric moves from about 4.62 to 4.67. Cost per useful output moves the other way, from 5.00 down to 4.67. The denominator changes the conclusion: technical success looks slightly worse even though business efficiency improves.
The tables combine billing results with schedule and business-rule classification; they are not raw query output. The SQL below provides the technical continuation for data teams that want to reproduce the billing portion.
WITH latest_terminal_state AS (
  SELECT workspace_id, job_id, run_id, result_state, period_end_time
  FROM system.lakeflow.job_run_timeline
  WHERE result_state IS NOT NULL
  QUALIFY ROW_NUMBER() OVER (
    PARTITION BY workspace_id, job_id, run_id
    ORDER BY period_end_time DESC
  ) = 1
),
terminal_runs AS (
  SELECT workspace_id, job_id, run_id, result_state
  FROM latest_terminal_state
  WHERE period_end_time >= TIMESTAMP '2026-08-03 00:00:00'
    AND period_end_time <  TIMESTAMP '2026-08-10 00:00:00'
),
current_jobs AS (
  SELECT workspace_id, job_id, name
  FROM system.lakeflow.jobs
  QUALIFY ROW_NUMBER() OVER (
    PARTITION BY workspace_id, job_id ORDER BY change_time DESC
  ) = 1
),
cohort_cost AS (
  SELECT
    u.workspace_id,
    u.usage_metadata.job_id AS job_id,
    COALESCE(u.usage_metadata.job_name, j.name, 'UNATTRIBUTED') AS job_name,
    r.run_id,
    r.result_state,
    SUM(u.usage_quantity * p.pricing.effective_list.default) AS list_price_cost
  FROM system.billing.usage u
  JOIN terminal_runs r
    ON u.workspace_id = r.workspace_id
   AND u.usage_metadata.job_id = r.job_id
   AND u.usage_metadata.job_run_id = r.run_id
  JOIN system.billing.list_prices p
    ON u.cloud = p.cloud
   AND u.sku_name = p.sku_name
   AND u.usage_start_time >= p.price_start_time
   AND (u.usage_end_time <= p.price_end_time OR p.price_end_time IS NULL)
  LEFT JOIN current_jobs j
    ON u.workspace_id = j.workspace_id
   AND u.usage_metadata.job_id = j.job_id
  WHERE u.billing_origin_product = 'JOBS'
  GROUP BY ALL
)
SELECT
  workspace_id,
  job_id,
  job_name,
  COUNT(DISTINCT run_id) AS billed_runs,
  COUNT(DISTINCT CASE WHEN result_state = 'SUCCEEDED' THEN run_id END) AS successful_runs,
  SUM(list_price_cost) AS list_price_cost,
  SUM(list_price_cost) / NULLIF(
    COUNT(DISTINCT CASE WHEN result_state = 'SUCCEEDED' THEN run_id END), 0
  ) AS cost_per_technical_success
FROM cohort_cost
GROUP BY workspace_id, job_id, job_name
ORDER BY list_price_cost DESC;
The query first finds each run’s latest known terminal state. It then places that run in the week when the state occurred. Suppose a run fails on Sunday and succeeds after repair on Monday. It belongs to the new week, and the usage attached to that run_id follows it instead of leaving a failure in the prior week’s cohort. This is a final-completion cohort, not a snapshot of status at the end of each reporting period.
Here, billed_runs means distinct run_id values that joined to billing and pricing records. The joined usage includes earlier failed work attached to a repaired run, so the final success retains the cost of reaching that result. Task-level retries still require separate run-timeline analysis. A redundant run may also finish with SUCCEEDED, so classify duplicate or unwanted runs from schedule history and business rules before calculating cost per useful result.
This query measures Databricks usage at effective list price, not full cloud total cost of ownership. For classic compute, add the corresponding cloud VM, disk, and network charges before comparing total cost with serverless.
The query also has attribution limits. It covers jobs compute and serverless jobs; jobs on SQL warehouses or all-purpose compute are excluded from job cost attribution. Run the query from a workspace in each cloud region that contains jobs you need to report. system.billing.usage is account-global, but system.lakeflow.job_run_timeline and system.lakeflow.jobs are regional. The user must either be both an account admin and a metastore admin, or have the required USE and SELECT privileges on the system schemas. See the official Databricks job cost guide for the current scope and permissions.
GroupBWT applied the same scope-first logic in a published Databricks migration blueprint for a legacy data warehouse. Over three weeks, GroupBWT mapped 18 sources and audited 260+ Power BI assets; that inventory kept 155 assets in scope and marked the remainder for retirement. The case proves delivered inventory and target design, not migration or savings.
Databricks Compute Choices Follow Workload Behavior
For cost optimization in Databricks, follow the platform’s current serverless-first guidance without treating it as a guaranteed saving. Databricks recommends serverless for most supported automated workloads and almost all pipelines. In Unity Catalog-enabled workspaces with serverless available, new notebooks also default to serverless when no other compute is selected. That does not make it automatically cheaper for every completed unit of work. Benchmark equivalent output, runtime, reliability, compatibility, and the applicable commercial price before deciding.
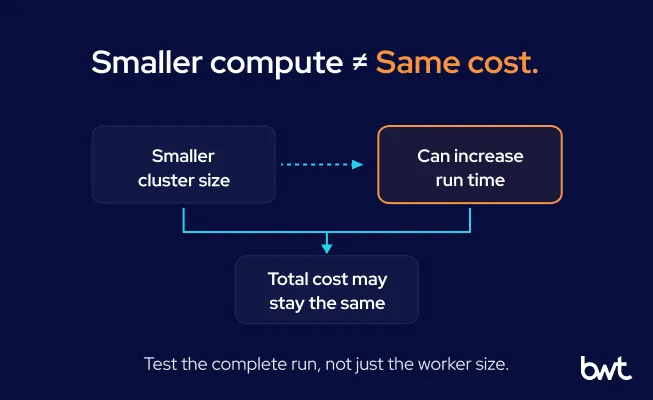
On classic compute, right-size through a controlled test. Change worker shape for one representative workload while holding input steady, then compare elapsed time, spill, failures, and consumption. A smaller cluster can cost the same if it runs longer or delays dependent work.
On classic compute, Databricks documents that compute policies restrict configuration choices, while auto termination ends inactive compute and autoscaling moves workers within configured bounds. These controls still need workload tests. An aggressive termination rule can trade idle cost for startup latency, repeated initialization, or cache warm-up.
On classic compute, spot capacity can suit retry-tolerant work when interruption recovery is designed. Use on-demand workers when an interruption would leave too little time to recover before the completion deadline. Separate heavy transformations from Databricks SQL reporting when contention, different service targets, or workload patterns justify independent scaling.
“The cheapest worker type on a rate card can be the expensive choice after shuffle, spill, and retries. Test the complete run with the same input, then compare consumption and elapsed time together.” — Alex Yudin, Head of Data Engineering at GroupBWT
Optimize Databricks Work Before Squeezing Compute
Remove unnecessary work before reducing capacity. Inspect schedule frequency, processing boundaries, and data layout, then ask why the plan reads and transforms that much data.
Incremental processing limits work to changed records when correctness permits. Full rebuilds remain valid for small data, reconciliation, or dependencies that make partial updates unsafe. Keep the reason for each full pass.
Duplicate pipelines often survive across teams, releases, and retired dashboards. If an output has no confirmed owner, keep the finding open, assign an accountable person, and escalate until someone confirms its purpose and approves a pause or retirement. Never treat missing ownership as permission to delete.
Compare plans for the same query class and inspect scans, joins, shuffles, skew, and spill. This helps show whether the workload is reading, moving, or recomputing more data than the required output appears to justify.
For Unity Catalog managed tables, evaluate automatic liquid clustering and predictive optimization before introducing manual partitioning or scheduled layout-maintenance jobs. The Databricks liquid clustering guidance recommends liquid clustering for new tables; custom partitioning is now the exception rather than the default. Include the serverless jobs charges generated by predictive optimization in the comparison.
Cost optimization for Databricks also requires measuring the execution engine’s cost effect, not only the cluster shape. Evaluate Photon on representative SQL and DataFrame workloads rather than assuming faster execution automatically means lower spend. Its DBU rate can differ from the equivalent non-Photon runtime, and unsupported operations can fall back to Spark. A faster run counts as a cost improvement only when the applicable rate and total consumption produce a lower cost for the same useful output. For SQL warehouses, judge concurrency and queue tolerance beside size and active windows.
Also Read: Databricks Data Migration for Mid-Market: A Step-by-Step Playbook
Databricks FinOps Gives Every Finding an Owner
Databricks FinOps connects platform telemetry with decision authority. Tags, workspace context, job identity, warehouse ownership, product origin, and SKU data support spend attribution; a named person decides whether a schedule or service trade-off is acceptable.
Use a minimum attribution record:
- service, product, and environment;
- one accountable owner;
- cost center or team label;
- unit of work and service target.
Showback reports cost without moving the expense. Chargeback allocates the expense to the responsible cost center, product, or budget. Both need explicit allocation rules for shared SQL capacity, platform services, and central development environments.
The Databricks budget documentation says budgets can track list-price spending by account, workspace, resource type, or custom tags and notify recipients when thresholds are crossed. Standard budget alerts monitor spending rather than impose a hard cap. Unity Gateway budgets can optionally block further usage at a threshold, but enforcement is approximate and does not guarantee an absolute final billed amount. Investigate an alert, assign the issue, and close it only after validation.
Databricks cost efficiency improves when unit cost falls while runtime, freshness, and reliability stay within agreed limits. For Databricks cost optimization at scale, reliable attribution matters more than another dashboard.
“Cost control stalls when finance owns the number, engineering owns the jobs, and nobody owns the decision. Put one accountable person beside each material finding, including the authority to accept the trade-off.” — Oleg Boyko, CCO at GroupBWT
Automate Reversible Databricks Cost Controls
Automation should speed a safe response, not let an anomaly detector rewrite production settings. Separate observation, reversible action, and approval-gated changes.
Start with a narrow condition: notify the owner, automatically terminate confirmed non-production compute after an approved idle period or operating window, or block a disallowed configuration at creation. Log the evidence, action, actor, and reversal path. Keep changes to production capacity, schedules, queries, and data layout behind owner approval when they can affect data correctness or a service target.
Escalate when the same cause recurs after a validated intervention or when the next action crosses the approved risk boundary. That supports Databricks cost reduction without turning a billing anomaly into an availability incident.
Prove Databricks Savings Against Equivalent Work
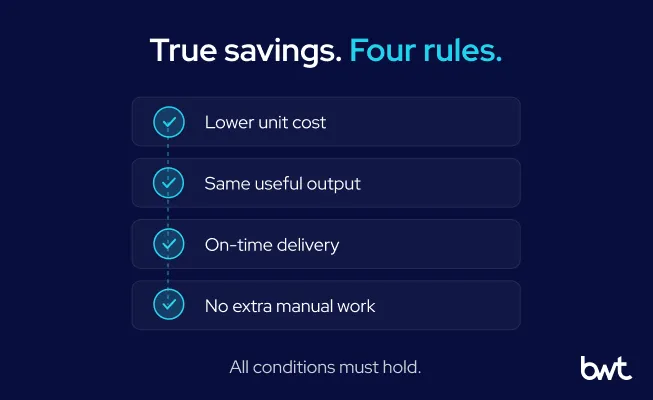
To verify an intervention, record its expected mechanism before the change and keep the output definition fixed. Normalize for volume, workload mix, and price changes. Document service-target changes separately so they are not mistaken for savings.
| Measure | Baseline record | Post-change acceptance |
| Cost | Comparable price basis and commercial terms | Lower total and unit cost, or a justified trade-off |
| Completed work | Workload-specific unit of useful completed work | Comparable volume and output definition |
| Service | Runtime, queue time, freshness | Inside the agreed workload range |
| Reliability | Failures, retries, incidents, engineer intervention | No material regression or hidden labor shift |
If cost falls because output falls, keep the finding open. If runtime rises but remains within the service target, the owner may accept the trade. If failures create more manual recovery, include that labor in the comparison and roll back if it breaches the agreed reliability or operating limit.
Lower Spend Is Sometimes the Wrong Objective
A higher bill can reflect more customers, fresher data, more model calls, or a new reporting obligation. Judge unit cost and business value before trying to return the invoice to last quarter’s total. Cutting successful demand is not optimization.
Databricks can be economically unjustified for a small, stable workload when its governance, lakehouse, scale, and AI capabilities exceed the requirements and a simpler platform can meet the same service targets at lower total cost. Compare governance, latency, workload variety, skills, and expected run pattern with simpler options.
Choose end-to-end data warehouse consulting services for a cost and performance assessment. Data engineering consulting services cover pipeline and workload remediation, while data warehouse development services fit broader platform implementation and ongoing engineering.
Make the Cost Review an Operating Habit
Attribute each material cost to a workload and owner where possible, or to an explicit shared-cost pool with a documented allocation rule. Link workload-level spend to its useful output and service target. Keep a record of the decision, owner, intervention, and validation result so the next review starts with evidence instead of another invoice investigation. This cadence turns practical Databricks cost management into an operating control.

Stable business volume can still hide retries, duplicate schedules, larger scans, longer active windows, or storage growth. The exception is justified demand such as fresher data or more model calls, where a higher total may be healthy. Separate the cost components and compare unit cost before resizing compute.
No, because duration, concurrency, startup sensitivity, operations, and contract pricing change the result. Serverless can be more economical for one workload, while classic compute may fit another when compatibility, infrastructure control, networking, or commercial terms justify it. Test the same completed work and include runtime, queues, failures, and freshness.
Join billing usage to temporal list prices, then group attributed Jobs usage by workspace and job. Jobs on SQL warehouses and all-purpose compute are excluded from this attribution path, so exact per-job ranking is unavailable from these billing records alone. Rank attributed Databricks usage cost and cost per technical success first, then classify which successful runs produced useful output.
Write the runtime, queue, freshness, output, and reliability limits before changing anything. A slower run can be acceptable when it stays inside the service target and produces the same output. Include new failures or manual recovery in the cost comparison, and roll back if they breach the agreed reliability or operating limit.
Begin with alerts, creation policies, or confirmed non-production shutdowns that have a clear reversal path. Production changes are the exception because they need the workload owner’s approval when they may change data correctness or a service target. Record the evidence, action, and validation result for every automated response.
Read summarized version with
Related Data Services
Review Databricks CostAgainst Real Workloads
GroupBWT reviews billing records, workload behavior, ownership, and service targets before recommending changes.
You receive:
- A comparable cost baseline
- Owner-mapped findings and safe first actions
- Cost, runtime, freshness & reliability checks