Read summarized version with


Introduction
No manufacturer opens with "our OEE is off." They open with something smaller. "I can’t find the file." "It takes an hour to prep one quote." "We lost the tender because we couldn’t see the market." The pain shows up at a desk first, an engineer’s or a sales rep’s, and only later on the line. The night supervisor watched the line slow at 3 a.m. and knew it in the moment. The report proving it reached the analytics team the following Friday. That gap, hours or days between the event and anyone acting on it, is the thing these programs exist to close. Scattered ERP, MES, sensor, and quality data have to land in one place fast enough to matter, and the dashboard is the easy part. Getting the data trustworthy is the slow part, and it takes most of GroupBWT’s time.
Data analytics in manufacturing runs the full distance, raw plant-floor and business data at one end, a decision at the other. Collect it, stitch it together, prove it holds up, then read it. The list runs long. ERP and MES on the business side. SCADA and PLC down on the line. Then the IoT sensors, and the quality, maintenance, and supply-chain systems wrapped around all of it. The point of pulling it together is blunt: push OEE (overall equipment effectiveness) up, take downtime down, spot defects earlier, and stop guessing at inventory. There’s a fourth payoff most of them miss. Do it right and a by-product shows up that few plants ever plan for: a data foundation clean enough to carry the next AI project without buckling.
Build the Data Foundation
We develop and manage custom data solutions, powered by proven experts, to ensure the fastest delivery of structured data from sources of any size and complexity. We offer:
- Custom Web Scraping & Development
- 15+ Years of Engineering Expertise
- AI-Driven Data Processing & Enrichment
Key Takeaways
- The value lives in the integration. Connecting ERP, MES, SCADA, PLC, IoT, quality, and supply chain data into one governed layer is the work. The dashboard is the easy mile.
- Five use cases return most of the money. Predictive maintenance, throughput, quality, inventory, energy. The rest mostly demo well.
- Programs fail on the data, not the chart. Poor quality, KPIs defined three ways across plants, systems that were never wired together.
- Real-time earns its cost only for the few decisions that genuinely cannot wait. Batch handles the rest.
- The AI everyone wants to add later runs on the same trusted data that feeds today’s dashboards.
What Manufacturing Analytics Covers
Manufacturing data analytics pulls plant-floor and business data into one governed model, so every chart reads the same numbers, and then reads that model to make better production calls. The question changes. Instead of "what did we ship last month?" you’re asking "what is happening right now, and what is coming next?" Old-style reporting adds up one or two systems after the shift is over. Analytics joins a dozen of them while they run, tells you why the numbers moved, and flags a bad feed at ingestion, not three days later in a report nobody trusts anyway.
Three terms get treated as one, and the mix-up wastes a lot of team time. BI reports the past off structured, historical data, and that’s the baseline most plants already run. Analytics pushes into the why and the what-next. That is the territory of root-cause work and forecasting. Big data is the raw foundation under both of them. Picture PLC streams, sensor readings, and historians moving too fast for any spreadsheet to hold. GroupBWT builds that raw layer, so the analytics and the AI sitting above it read from something that holds still.
What Unified Plant Data Actually Buys You
Spending on manufacturing data analytics programs keeps climbing, and there is one reason behind it: unify the data, and the gap between an event and a decision shrinks. Deloitte’s 2026 Manufacturing Industry Outlook found that 80% of the 600 executives it surveyed plan to put at least a fifth of their improvement budgets into smart manufacturing, with analytics among the foundational tools. The problem it solves is timing. Most plants only spot a stoppage or a quality drift once the numbers have already crossed a threshold. Real-time visibility buys back the window where someone can still act, and it frees the people who own OEE and margin to do that instead of rebuilding spreadsheets.
Manufacturing Analytics Maturity Model
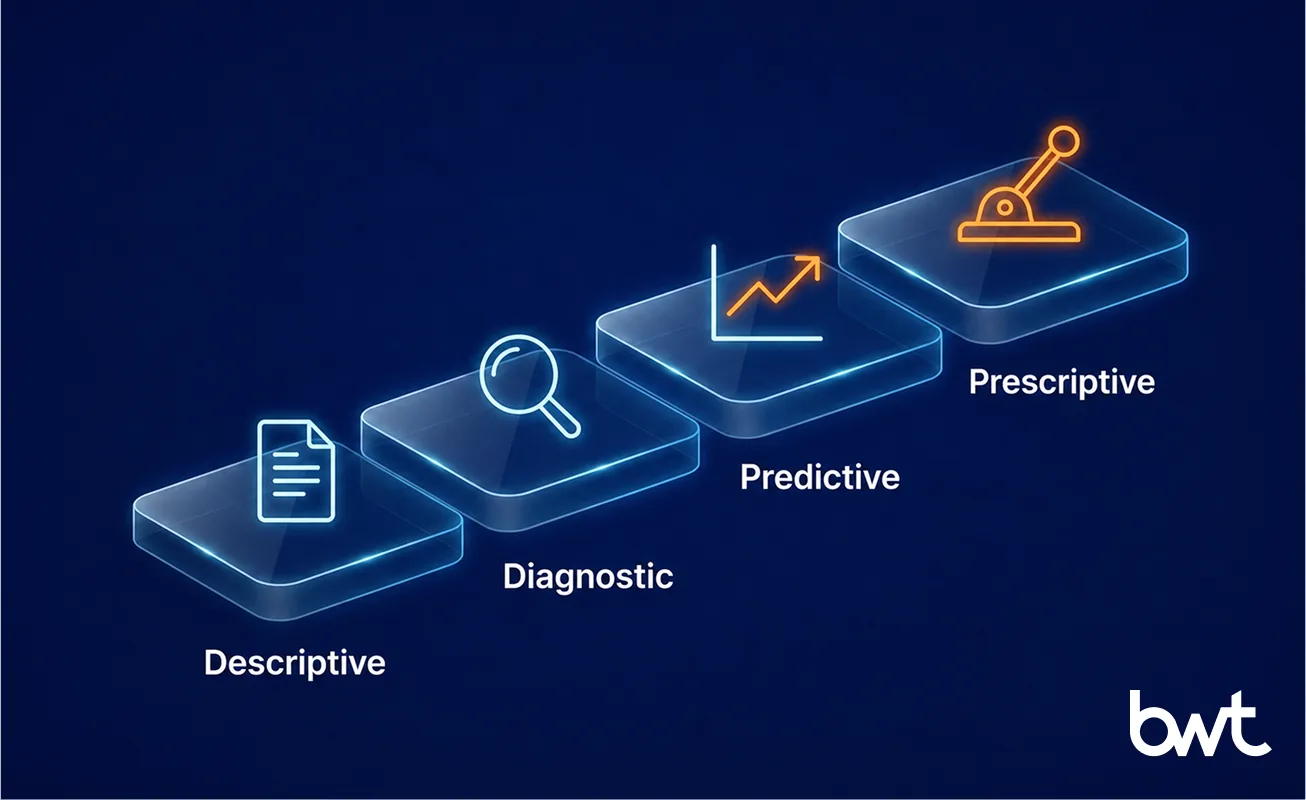
Analytics climbs through four questions, and you cannot skip a rung. You cannot forecast on numbers you cannot yet describe the same way twice. Most plants sit lower on this ladder than they would guess, and the blocker is almost always the data underneath, not the model.
| Analytics maturity stage | Question it answers | Typical manufacturing output | Data requirement |
| Descriptive | What happened? | Output, scrap, and downtime reports off one source | Consistent historical data |
| Diagnostic | Why did it happen? | Root-cause analysis by station, shift, batch, or asset | Joined operational and contextual data |
| Predictive | What is likely to happen next? | Failure risk, demand forecasts, quality prediction | Clean historical data with reliable labels |
| Prescriptive | What should we do? | Recommended maintenance, production, or inventory action | Trusted data, models, business rules, and an activation layer |
The Five Data Families a Plant Has to Connect
Five families of systems feed a plant, and not one of them was designed to speak to the next. Bridging them is the actual engineering. And it is messier than it sounds. ERP, MES, and SCADA each hold a piece of the truth, business and execution, yet all three tag the same machine, batch, or order under a different name. Then there are the machines and sensors, adding billions of readings a day through PLC streams and historians (databases that log every machine reading over time). Quality and inspection data is what turns a scrap figure into a cause you can trace back to one station. Maintenance and downtime history is what every predictive-maintenance model learns from. And supply-chain records tie what the plant can build to what the market actually wants.
Manufacturing Data Analytics Use Cases
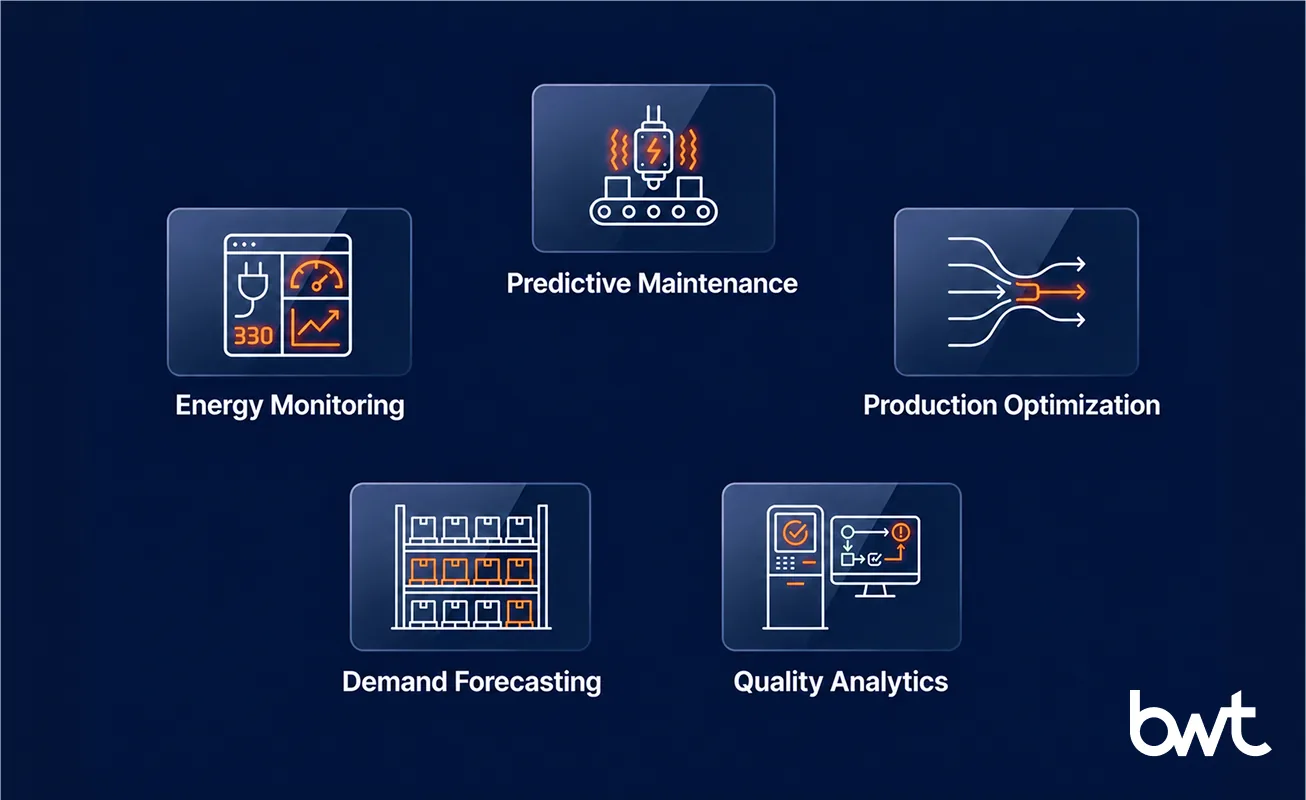
The use cases that earn their keep share one trait. Each ties a specific data source to a decision someone already owns. Five carry the rest.
Predictive Maintenance and Failure Prevention
Predictive maintenance spots the bearing or motor about to go, while the line is still running. The payback is sharpest where an idle line bleeds revenue by the hour. It rests on one thing, though. You need enough clean failure history for a model to learn the pattern.
Throughput and Bottleneck Analytics
Throughput work joins MES and machine data until the real bottleneck surfaces. It is rarely the station everyone blamed. Once the true constraint is visible, a shift lead can rebalance the line instead of guessing at it.
Quality Analytics and Defect Reduction
Feed vision and sensor data into quality analytics and defects get caught earlier in the process. Scrap and rework drop. The scrap number stops being a month-end surprise. Now it points somewhere, back to a station, a shift, or one bad batch of material.
Inventory and Demand Forecasting
Put demand, inventory, and supplier signals side by side, and two numbers move at once: turns up, stockouts down. No clean history, no forecast worth trusting. So it waits, until the first two data families are clean enough to build on.
Energy Monitoring and Optimization
Energy analytics does something quieter. It turns a year-end line item into a daily dial the plant can actually steer, so the steps that burn the most get retuned or rescheduled instead of noticed in an annual review.
"Two plants will both swear they hit 92% OEE, and both will be right. They just measure it differently. Analytics starts by agreeing on what the number means, not by building the chart." — Alex Yudin, Head of Data Engineering at GroupBWT
Benefits of Data Analytics in Manufacturing
The gains from data analytics in manufacturing land on the floor first, as operational wins, and only later read as strategy. Hours saved. Decisions made sooner. One caveat sits under all of them: the numbers feeding the dashboard have to be trusted. Once they are, five benefits compound on the same unified data.
- Better production visibility. One shared view of OEE, throughput, and scrap replaces a stack of per-site spreadsheets, so two plants stop reporting the same metric three ways.
- Faster, better-informed decisions. A flagged bearing becomes a planned stop instead of a blown shift.
- Less waste, downtime, and maintenance cost. The scrap rate becomes a number you trace to a station, not one you explain away at month-end.
- Steadier quality and process consistency. Defects caught at inspection stop reaching the customer.
- Stronger forecasting and planning. On-time-in-full becomes a figure you can actually steer, not just report after the fact.
None of it holds if the dashboards feeding these decisions disagree, which is the gap our end-to-end data warehouse services close first.

Real-World Manufacturing Analytics Examples
Here are three anonymized engagements. The real problem in each, and what actually changed.
Continuously refreshed competitive pricing, automotive. A global automotive components manufacturer set pricing off competitor reports that lagged a quarter to a year, and lost bids it never saw coming. Working from public competitor pricing, GroupBWT assembled a continuously refreshed competitive-pricing dataset behind a real-time dashboard. The market view that used to be a quarter old became same-day, so quotes moved with the market instead of trailing it.
Multi-site lakehouse discovery, industrial. An industrial-scale producer running a dozen plants sat on thousands of tables across two dozen disconnected systems and hundreds of Power BI reports that routinely disagreed. GroupBWT mapped the ERP, MES, and operational estate and produced a target Databricks Lakehouse architecture (Medallion zones under Unity Catalog) with a migration roadmap designed to consolidate those disagreeing reports onto one governed source. The discovery replaced the argument over which report was right with a costed plan to make one source authoritative, and it left the estate ready to carry AI on top.
Shelf-sales analytics, cosmetics. A global decorative-cosmetics maker had retailer sales landing in dozens of shapes that refused to line up. Monthly Excel from one account, weekly CSV from another, one file that stuffed ten countries into a single tab. GroupBWT built a governed platform on Data Vault 2.0 and pulled every one of those feeds into one shelf-sales view across 24+ countries. The six-week pilot has since grown into 40+ production pipelines. Country teams read one sell-through number now, instead of reconciling spreadsheets by hand.
None of these was a line-level OEE rollout. They cover pricing, supply chain, and lakehouse-foundation work across manufacturing and the commercial functions next to it. Trade the retailer file for a PLC stream or a quality-inspection feed, and the integration-and-governance playbook underneath doesn’t change.
How Manufacturing Analytics Architecture Works
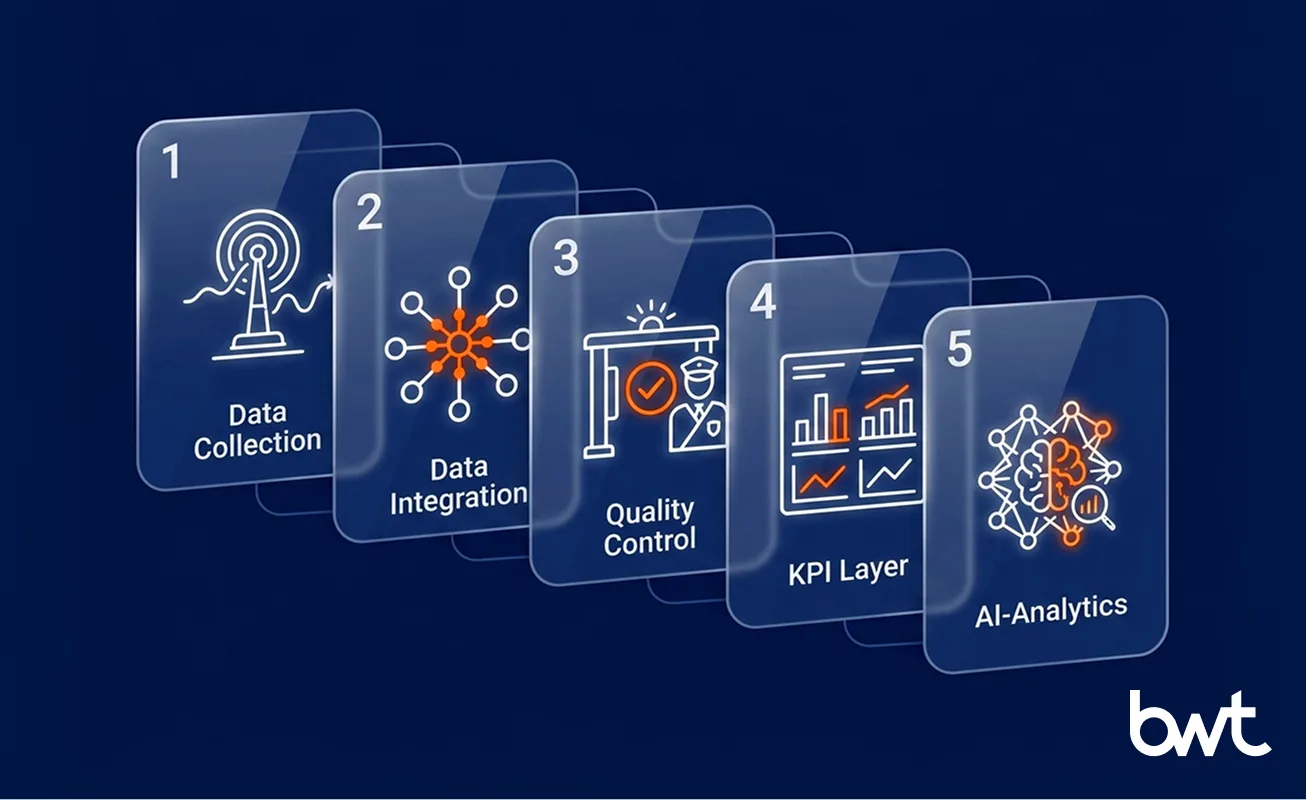
A working setup has five jobs, and the order matters. Skip one and the layer above it inherits the mess.
1. Plant-Floor Data Collection
Collection has to respect the plant floor. To reach a proprietary PLC you have to speak what the controller speaks, OPC-UA, Modbus, or MQTT. And you do it without opening a hole in the wall between the factory network and IT. Every feed terminates at this layer, the ERP and MES, the SCADA, the sensors, the historians.
2. Data Integration and Entity Resolution
Integration folds everything into one governed model where "machine 12" and "batch 4471" mean the same thing everywhere. Our data engineering services build that layer, so a report out of one plant squares with the report out of the next instead of fighting it.
3. Validation and Data Quality Controls
Validation gates check every load. When a source quietly renames or drops a field, a schema-drift alert fires. Impossible values, a negative cycle time, a duplicate reading, get caught here too, before any of it reaches a chart.
4. Semantic and KPI Layer
On top of clean data sits a shared KPI layer, where each number maps to an action someone owns.
| KPI | What it tracks | Business action |
| OEE (Overall Equipment Effectiveness) | Availability × performance × quality on a line | Rebalance the line or service the worst-performing asset first |
| Scrap rate | Share of output rejected | Trace the defect to its station and fix the upstream cause |
| Unplanned downtime | Hours a line stops without a plan | Aim predictive maintenance at the costliest stoppages |
| MTBF (Mean Time Between Failures) | Average run time between breakdowns | Set maintenance intervals and spare-parts stock per asset |
| Energy per unit | Energy consumed per unit produced | Retune or reschedule the most energy-intensive steps |
| OTIF (On-Time-In-Full) | Orders delivered complete and on time | Re-sequence production and flag at-risk orders early |
5. Analytics, Alerts, Forecasting, and AI
The stack then serves that data at the speed each decision needs. Streaming feeds answer "what is happening now"; historical depth answers "is this normal." Each user pulls a dashboard, an alert, a forecast, or a model feed from the same governed layer.
Where Manufacturing Data Analytics Programs Stall
Knowing where it breaks matters as much as knowing how to build it. A decade-old ERP plus dozens of undocumented systems is the normal starting line, so the first move is an inventory, not a rebuild. One manufacturer we scoped ran a 20-year-old AS/400 ERP under 32 separate business systems, 400+ custom Delphi programs patching gaps the ERP left, and 12 support portals opened by hand every morning, kept alive by an IT team of fewer than ten across every plant. Another ran on three disconnected databases, roughly 1 TB and 150 users. There, digital adoption was blocked less by the technology than by a workforce that never wanted screens on the floor. Then there is data quality. Missed readings, drifting sensors, a KPI defined one way here and another two plants over. Real-time availability is its own wall, since plenty of plant data sits behind controllers and batch exports. Governance carries obligations too. ISO 9001 and IATF 16949 are the quality standards manufacturers get audited against, and those audit trails have to live inside the pipeline from day one, not get bolted on once the auditor books a date. The last gap is the worst one. A dashboard is worth only the decision it changes, and programs stall when the numbers reach the operator too late to act on them.
"Most teams ask for real-time and actually need yesterday’s numbers by 7 a.m. Real-time is expensive. Spend it on the two or three decisions that genuinely cannot wait, and batch the rest." — Dmytro Naumenko, CTO at GroupBWT
Manufacturing Analytics and AI
Out in the plants, analytics and AI get adopted far slower than the headlines suggest. Firm-level AI use sat near 18% going into 2026, per U.S. Census Bureau data, and the Federal Reserve flagged that in early 2026: a long way behind the front of the pack. The mistake is running analytics and AI as two separate projects. The governed, labeled data behind a dashboard you can trust is the exact same data a model trains on. Starve the model of that labeled history and it learns nothing worth acting on. No failure history yet? Unsupervised anomaly detection can catch the outliers while you wait, and forecasting follows once the labels pile up. The programs that scale are the ones that fixed the data first. The lakehouse discovery above is one more case of it.
Five Practices That Decide Whether a Program Pays Back
- Start with high-impact business problems. Fund the three use cases that pay back, not the twenty that demo well.
- Connect ERP, MES, SCADA, and IoT data early. Build a KPI from two of five sources and the other three stay dark, along with whatever they would have shown.
- Define KPIs before building dashboards. Skip the definitions and the dashboard just broadcasts the disagreement faster, now in color.
- Standardize data quality and governance. Validate at ingestion, not after a bad report, the case we make in our guide to data readiness for AI.
- Build for scale across plants and teams. A reusable pipeline template keeps onboarding cheap as the system grows.
"Be honest about the bill. A managed data team usually costs more than the in-house headcount it replaces. You are buying speed and a number you can trust, not cheaper labor." — Oleg Boyko, CCO at GroupBWT
What Comes After the Dashboard
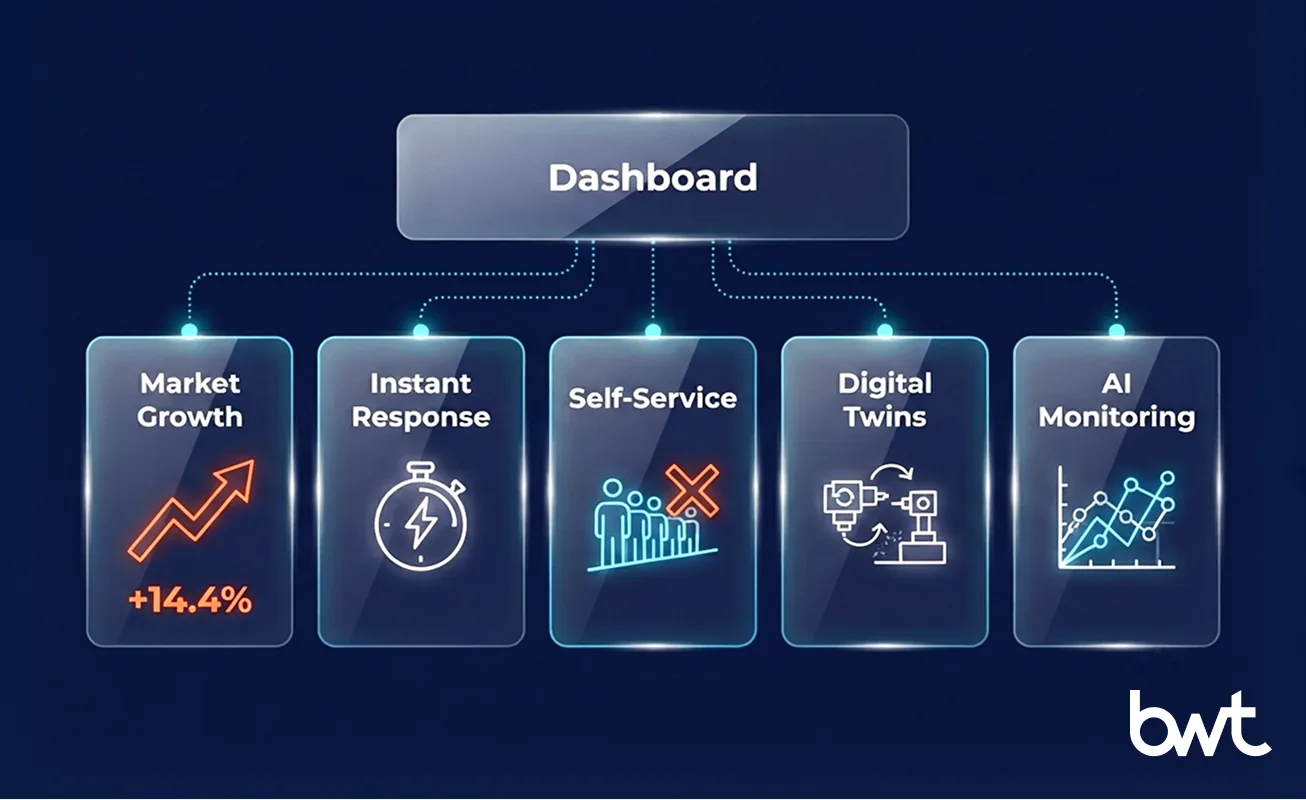
Spending is climbing. Mordor Intelligence sizes the big data analytics in manufacturing market at USD 7.3 billion in 2025 and projects USD 14.3 billion by 2030, a 14.4% CAGR. The pull on every data analytics for manufacturing team points one way: toward decisions made closer to the machine. Smart factories run connected lines where a deviation triggers a correction in seconds. Operators answer their own questions from governed datasets instead of queuing in central reporting. Digital twins test a change before it touches the floor, honest only as far as the sensor data feeding them. As more models hit production, the layer watching them for drift starts to matter as much as the models it watches.
When Manufacturers Need a Data Analytics Partner
Outside help with data analytics for manufacturing industry operations earns its place at a few specific moments: when the sources multiply faster than your team can integrate them, or when a migration has to run without taking leadership dashboards offline. An acquisition that just doubled your systems with a second ERP and MES is another trigger. So is the moment the same KPI reads differently in two plants and nobody can say which one is right. A good partner builds the unglamorous foundation under all of that: multi-source integration, a governed warehouse, validation and monitoring, and the semantic layer that makes a KPI mean the same thing in every plant. Before you sign, press them on specifics. How do they reconcile records across systems that disagree? How do they run a migration in parallel so no dashboard goes dark? A focused ERP and MES integration runs in weeks to a few months, not years.
It gathers plant-floor and business data, machine, sensor, ERP, MES, quality, maintenance, into one governed store, then reads that store to make sharper production calls. A plain report looks at one or two systems, and only once the shift has already ended. The analytics version does more. The analytics version ties a dozen live systems together and lays a forecast across them, so the what, the why, and the what-next land together instead of one report at a time.
Clearer visibility into production. Faster calls. Less waste and downtime, steadier quality, forecasts you can actually plan against. You rarely get one without the others. All five rest on the same trusted, unified data, so they tend to land together. So how much of that benefit you keep comes down to the foundation, not the front end. It counts for far more than whatever dashboard ends up on top.
Legacy systems that never connected. Poor data quality. KPIs defined one way here and another way two plants over. Thin real-time access, governance load, and the stubborn gap between a dashboard and a decision. Notice what they share. Almost none of them are modeling problems. They’re data and integration problems, and you solve them upstream of any chart.
BI tells you what already happened, working off structured, historical data. Analytics goes further. It reaches the why and the what-next by pulling in more sources and layering statistical and machine-learning models over them. Almost every plant already runs some BI. Start there, treat it as the floor. Analytics is the step after, the one that turns a static report into something a person can act on.
Big data is the raw material, and there is a lot of it. Think PLC streams, sensor readings, and historians moving far too fast for a spreadsheet to hold. Analytics is what you do with it. Clean it, join it, model it, and out the other end comes a decision. The big-data foundation has to exist first, sure, but sitting there it earns nothing until analytics starts reading from it.
Read summarized version with
Build the Data Foundation
We develop and manage custom data solutions, powered by proven experts, to ensure the fastest delivery of structured data from sources of any size and complexity. We offer:
- Custom Web Scraping & Development
- 15+ Years of Engineering Expertise
- AI-Driven Data Processing & Enrichment