
CLIENT STORY
A UK-based specialty credit provider funds law firms and their clients through litigation cases, structured across several legal entities, each with its own investor pool. A single £5M loan to one law firm can carry 50,000 underlying consumer claims, each needing individual tracking. The firm raises capital from investors and earns the spread between portfolio returns and investor payouts. Accurate monthly reporting is therefore a core operating requirement.
| Service: | Data Engineering |
|---|---|
| Industry: | Finance |
| Year: | 2026 |
| Region: | UK |
Read summarized version with


Everything we've done historically has largely been in Excel… And then we produce investor reports, which we create basically in PowerPoint. So Excel will create the numbers and then those get put into PowerPoint. — President, UK Specialty Credit Provider
We want to clean the data, make sure it's correct, have an audit trail, and produce a visually appealing report. — President, UK Specialty Credit Provider
The Challenge: A Reporting Cycle Assembled by Hand
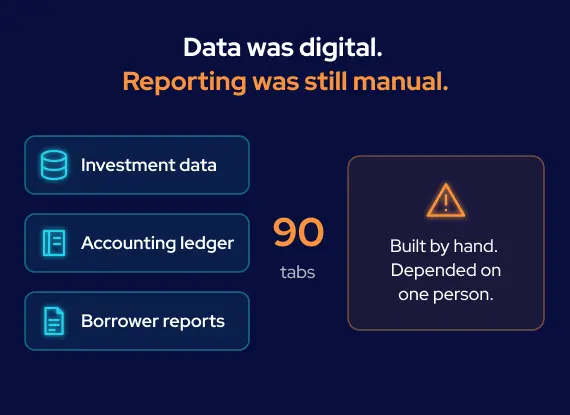
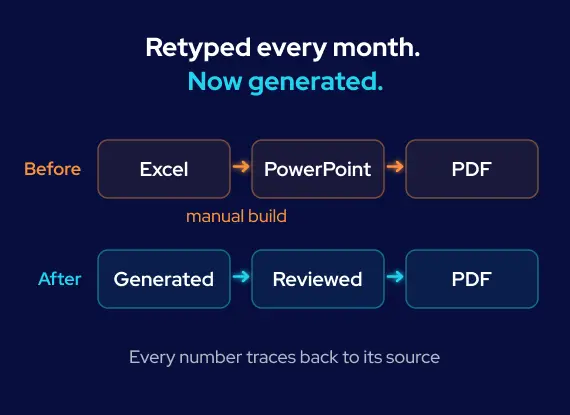
The firm’s investor reporting process ran largely through Excel: spreadsheets held the calculations, PowerPoint became the presentation layer, and PDF was the final investor output. Loan data typed in by hand at origination fed valuation spreadsheets built from borrower reports arriving by email.
The client had already started moving parts of its investment data into Supabase and rebuilding some calculations in Python, but investor reporting still depended on the legacy Excel and PowerPoint workflow. The breaking point sat in three linked workbooks with 90 tabs, pulling data from 40 supporting files.
The process also had to support a growing number of legal vehicles and investors, while some calculation rules differed by investor. Knowledge was concentrated in one reporting owner, while parts of the calculation methodology existed only in Excel formulas and working knowledge rather than in a formal specification. The firm did not have an in-house technical team to rebuild the reporting process.
Rebuilding the Calculation Layer Behind Investor Reporting
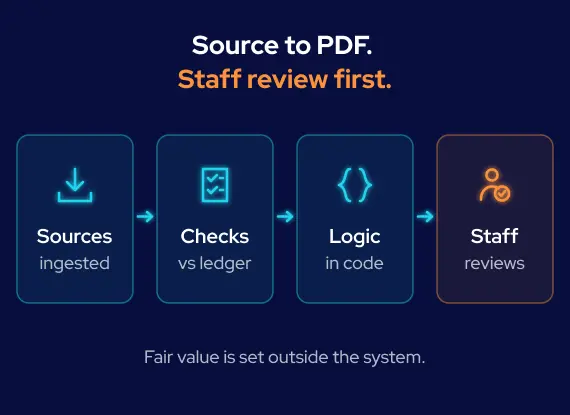
Rather than script the existing PowerPoint export, GroupBWT built the calculation foundation first. Fair-value calculation remains outside the system’s scope, a boundary the client defined; the reporting workflow begins once fair value is set.
Calculations Move From Cells Into Code. GroupBWT connected Xero, Supabase, and the borrower reports the firm already receives to a coded calculation layer. It generates the reporting outputs, with each number traceable to its source rather than to a formula embedded in a cell.
Validation Stops Source Errors Before Reporting. Incoming borrower reports run through validation and reconciliation against the firm’s own ledger before they feed a calculation. This catches mismatches before they become part of an investor report.
An Admin View Replaces the Manual Build. Staff can review and edit the generated report, then export it to PDF from one screen. The system replaces the 90 linked tabs and 40 supporting files as the place where reporting logic is held.
Tech stack: Python, PostgreSQL, automated PDF generation, data validation and reconciliation layer.
The tempting shortcut is scripting the PowerPoint export. We pushed for the calculation layer first — once the math lives in code instead of ninety linked tabs, report generation becomes an output of the system rather than another manual workflow.

One Traceable System for Monthly Investor Reporting
- By moving borrower-report ingestion, validation, and calculation into a coded pipeline, GroupBWT automated the reporting workflow that previously relied on manual retyping for the monthly PowerPoint build.
- The client estimated that automating the reporting workflow could free capacity equivalent to one full-time role. This is a client estimate, not an independently audited saving.
- By tracing every reported number back to its source data, GroupBWT replaced formulas buried in cells with source-level traceability.
- Moving the business logic into code made the calculation rules explicit, testable, and maintainable instead of leaving them distributed across workbook formulas.
Looking to Replace Spreadsheet-Based Investor Reporting?
If your monthly reporting still runs through linked spreadsheets and manual PowerPoint builds, we can design a validated, source-traceable workflow around the way your team actually reports.



You have an idea?
We handle all the rest.
How can we help you?