
CLIENT STORY
The client is a European retail chain with more than 120 stores and an online shop that’s still growing. Home goods, appliances and seasonal lines make up a range of more than 18,000 SKUs. An item could sell well in one city and stall in the next, and weather, season, price and promotions kept moving it around. Each new store made that harder to plan for, and leadership wanted to know, weeks or months ahead, what every store should be stocking. Full shelves, yes, but not with cash sunk into products nobody was buying yet.
| Service: | Data Analytics |
|---|---|
| Industry: | Retail |
| Year: | 2025 |
| Region: | EU |
| Cooperation type: | Ongoing Partnership |
Read summarized version with


"We had eighteen thousand SKUs across a hundred and twenty stores, and the only forecasts anyone trusted were spreadsheets the planning team rebuilt every Monday." — VP of Supply Chain
"Now a shortage shows up on the dashboard with time to act, instead of showing up as an empty shelf after the sale was already lost." — Head of Store Operations
The Challenge: Stockouts in Some Stores, Overstock in Others
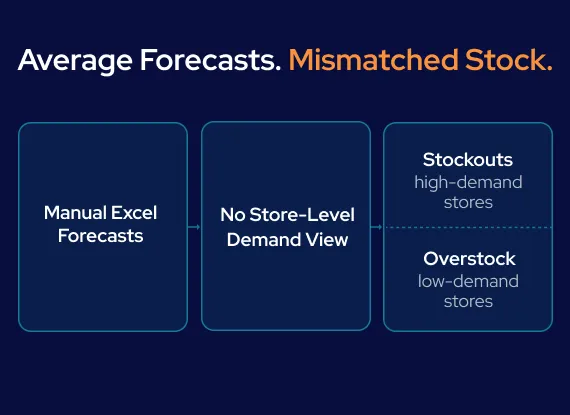
Before GroupBWT, planners rebuilt category forecasts by hand in Excel every week — one workbook per category, reconciled manually against whatever sales data each store manager had sent in. Online orders and in-store sales were planned as two separate businesses, even for the same SKU sitting in the same regional warehouse.
The mismatch showed up on the floor. A product that sold out in one store within days would sit untouched two towns over, and nobody caught it until a store manager called or a warehouse audit turned up pallets nobody had ordered against real demand. Promotions and seasonal swings made the spreadsheets worse — a forecast built on last month’s average couldn’t see a heatwave coming, or a holiday spike three months out.
Buyers had to commit to purchase orders months ahead, but the only forecast anyone trusted covered a few weeks with any confidence. Every wrong guess landed on the P&L as either a stockout or a markdown.
A Store-and-SKU-Level Forecasting Pipeline From Nine Data Sources
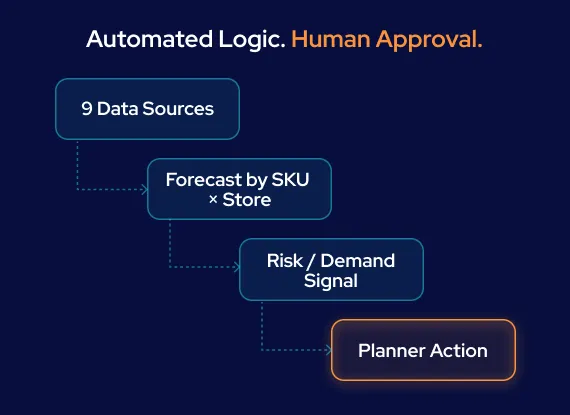
One Unified Forecasting Dataset. GroupBWT combined POS sales, inventory levels, prices, promotions, e-commerce orders, weather, product catalog, store attributes, and procurement data — including open purchase orders and expected inbound deliveries — into a single SKU × store × time dataset: three years of weekly history and more than 25 million SKU-store observations, covering active SKU-store combinations rather than the retailer’s full SKU × store matrix, cleaned for inconsistent IDs and missing values before any model saw the data. Stockout periods were flagged and excluded from training so the model did not learn artificially low demand simply because a product had been unavailable to sell.
Models Matched to Demand Behavior. A single model tuned on the chain average flattens both a consistently selling staple and a weather-sensitive seasonal product, so products were segmented by demand behavior, using patterns such as stability, seasonality, and variability, and modeled accordingly. GroupBWT compared regression and tree-based models on past periods, measuring how far forecasts were off and whether they consistently ran too high or too low. Regression was kept wherever it matched a more complex model’s accuracy — favoring a forecast buyers could defend to finance over a marginal accuracy gain they couldn’t explain.
One Pipeline, Three Planning Horizons. GroupBWT didn’t build a separate system for each planning horizon; each one got its own models and features, but they all ran on one shared pipeline. Replenishment only needed to see one to four weeks ahead. Inventory planning worked one to three months out, and purchasing and seasonal buys went up to six months. Near-term weather signals went into the shortest horizon. Weather can’t be forecast months ahead with any confidence, so the longer purchasing horizon ran on seasonality and planned promotions instead. Planners had kept one spreadsheet per horizon and reconciled them by hand; now one forecasting system covered all three.
Piloted on Selected Stores, Then Scaled Network-Wide
Piloted Before It Touched Every Shelf. GroupBWT ran the pipeline across a 15-store pilot spanning two product categories for eight weeks, checking forecast performance against real sales before rolling it out network-wide — a step that caught incorrectly mapped promotion dates before full rollout. Eight weeks can’t tell you whether a six-month forecast holds up, so only the short-term forecasts were checked against live sales, and GroupBWT tested the one-to-three-month and six-month horizons with historical backtesting only.
Exceptions Instead of Spreadsheets. Once it went live, the pipeline ran every new forecast against what was in stock and what was already on its way, and flagged a likely shortage or overstock without anyone going looking for it. It also kept score against actual sales, so drift got caught early. Some things no model sees coming – a new store opening, a local promotion, a one-off spike – and for those a planner could still override the forecast by hand.
Omnichannel Demand Forecasting Across Stores and E-commerce. Online orders and store sales finally went into the same forecast, without the store, warehouse and channel numbers getting blended away. Say a planner opened one SKU. They’d see its forecast store by store, by regional warehouse and by channel, size each store’s replenishment off that, and adjust purchasing quantities for the region.
Tech stack: Python, pandas, regression models, XGBoost, LightGBM, a feature store for lag and rolling-average features, weather API, POS and e-commerce data pipelines, automated retraining, planning dashboard
For a buyer who has to defend a purchase order to finance, an explainable regression model beats a marginally more accurate black box. That's why we backtested the simple approach before reaching for anything heavier.

24% Lower Fast-Mover Stockout Rate, 18% Lower Excess Inventory Rate, 30% Less Manual Forecasting Work
Backtesting on held-out historical periods showed lower forecast error and less systematic under-forecasting than the retailer’s previous spreadsheet baseline, with the sharpest gains on fast-moving items — the SKUs with the highest sales velocity. The results below are from the system’s first full quarter running network-wide, compared with the same quarter one year earlier across like-for-like stores.
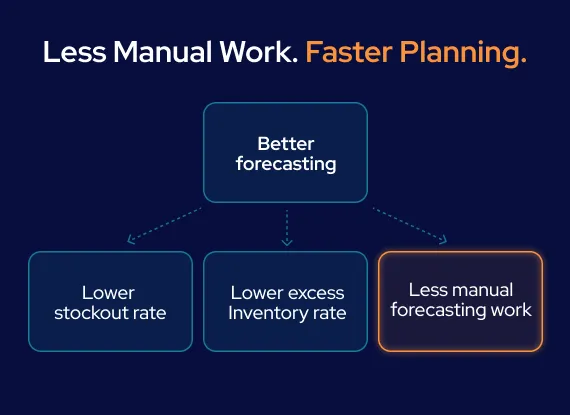
- By forecasting demand at the SKU × store level and setting each store’s replenishment from those forecasts, GroupBWT reduced the stockout rate on fast-moving items by 24%.
- GroupBWT caught overstock early, shifted it with transfers and scaled back the next reorders, and that brought the excess-inventory rate down 18% and the markdown rate down 15%.
- GroupBWT automated the Monday spreadsheet rebuild, which took roughly 30% of the manual forecasting work off planners’ desks, and they still handled exceptions, overrides and purchasing decisions themselves.
Losing Sales to Stockouts in Some Stores, Not Others?
If your team still builds store forecasts in spreadsheets, we can take that off their plate with an ML system that predicts what each store will sell, product by product, weeks or months out.




You have an idea?
We handle all the rest.
How can we help you?