CLIENT STORY
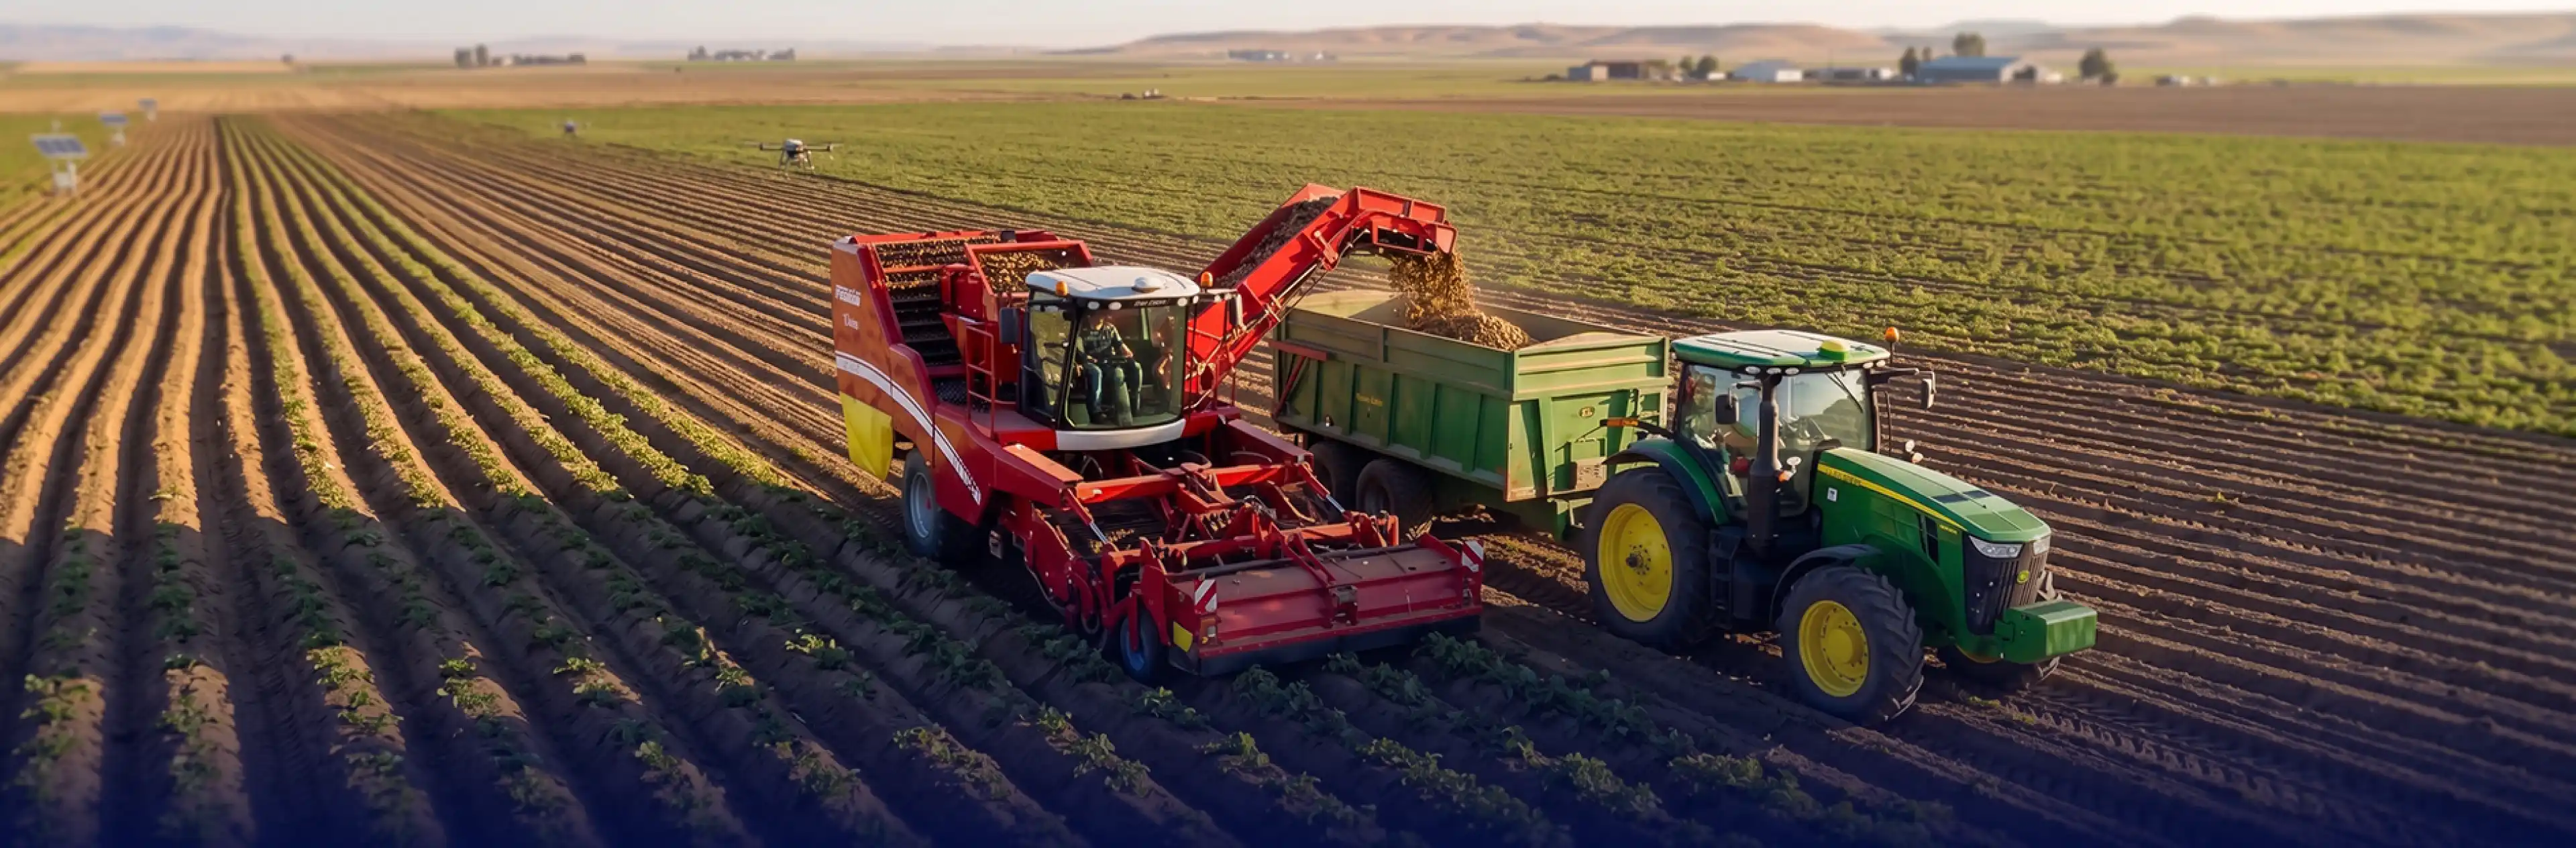
A leading US potato grower supplies a major snack-food manufacturer. An appearance score determines whether each shipment goes out or gets rejected. The company’s 25-year research archive covers soil samples, petiole diagnostics, irrigation and weather logs, harvest and transport records, plus scanned field reports created before its digital systems. Instead of waiting for a dashboard tied to last quarter’s questions, the team wanted to ask its structured operational data new questions in plain language through an analytical AI agent.
| Service: | AI Agent Development |
|---|---|
| Industry: | Agriculture |
| Year: | 2026 |
| Region: | USA |
| Cooperation type: | Ongoing Partnership |
Read summarized version with


"I think we have like all the inputs. It's just bringing intelligence to that — and we have not been able to do it, put them all together, because it's complicated." — Chief Production Officer, US Potato Grower
"How do I set it up so I can easily ask the questions that I have for this day — because tomorrow I'll ask a different set of questions, because the conditions are different." — Chief Production Officer, US Potato Grower
The Challenge: Every Question Meant Manual Integration
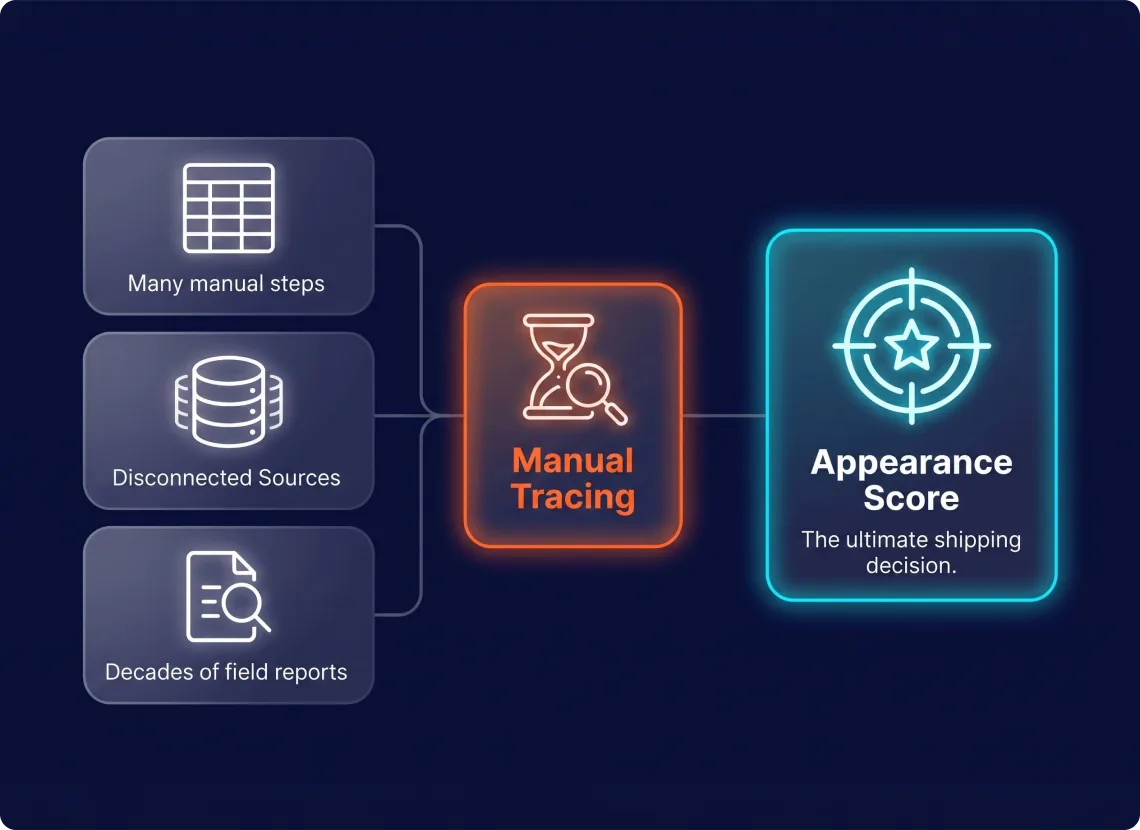
The company had already tried a simpler approach: exporting data into Excel and layering Copilot on top. It didn’t work, and the team could name exactly why — pulling the right numbers together took too many manual steps, and even then, not every dataset the analyst needed had made it into the sheet.
Operations ran across roughly 20 operational data sources that had grown organically over a decade, with scripts and scheduled jobs layered on top of one another and no common cross-system model for fields and relationships. Decades of research also sat in scanned field reports predating those systems — a separate archive the connected layer doesn’t parse yet. GroupBWT scoped the first analytical layer to the 14 structured sources feeding the appearance-score decision, covering records back to 2018; the scanned archive and the remaining sources stay on the roadmap for a later phase.
Every shipment’s appearance score decided whether it shipped or got rejected, and the team wanted to understand what was behind that score, not just report it. With fresh field data piling up daily across disconnected systems, no one person could keep tracing those relationships by hand.
An Analytical AI Agent Built on a Validated Data Layer
GroupBWT’s AI agent development team built a semantic data layer and an analytical AI agent on top of it, giving the client’s analysts direct, auditable answers to agronomic questions across the 14 connected data sources.
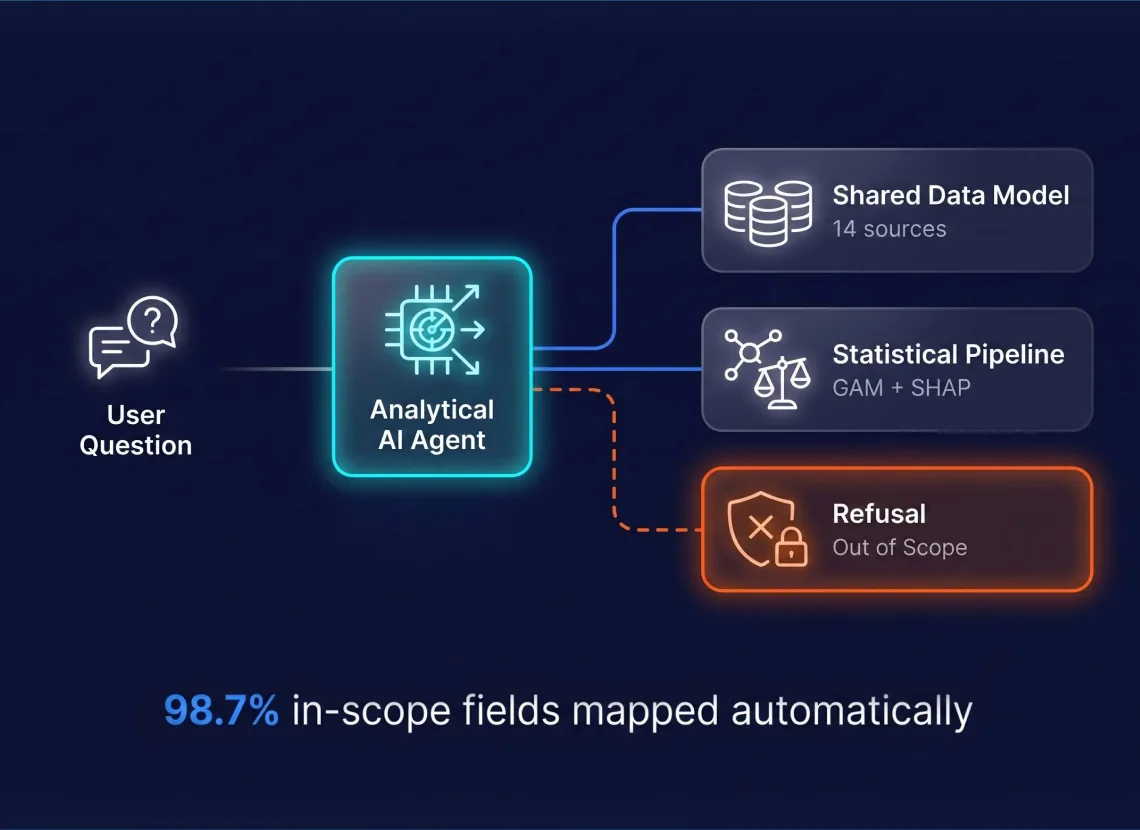
Shared data model. GroupBWT built a semantic layer defining the in-scope fields and relationships across the 14 connected data sources, so joins come from defined relationships rather than being inferred ad hoc. Automated matching resolves 98.7% of in-scope field mappings on its own; a person reviews only what’s left.
Routing, not guessing. GroupBWT built an analytical AI agent that classifies each question first. A factual question — soil moisture in June — goes to a SQL layer over the shared data model. An analytical question — which inputs are most associated with a lower score — routes to a versioned statistical check. Anything outside scope returns a refusal, not a guess.
Versioned statistical analysis. For questions about which inputs are most associated with the appearance score, GroupBWT used a versioned statistical pipeline instead of a freehand answer. A generalized additive model, or GAM, fits the relationship between inputs and score; SHAP, a feature-attribution method, explains how much each input contributed to that specific model output. Every answer traces back to the model version and the data behind it — an association ranked by contribution, not a causal claim.
In practice: an agronomist wants to investigate what changed around a field’s lower appearance score this season. The analytical AI agent routes the question to the statistical check, which pulls soil, petiole, irrigation, and harvest data for that field, runs the GAM and SHAP analysis, and returns the inputs most strongly associated with the lower score, ranked by model contribution, with the underlying records attached.
Tech stack: Databricks, Genie, GAM, SHAP
The data was there — the intelligence over it wasn't. We connected 14 sources into a validated layer and built an analytical AI agent that routes questions instead of guessing at answers: it answers in minutes instead of someone assembling data by hand first.

Automated Daily Ingestion and Answers in Minutes
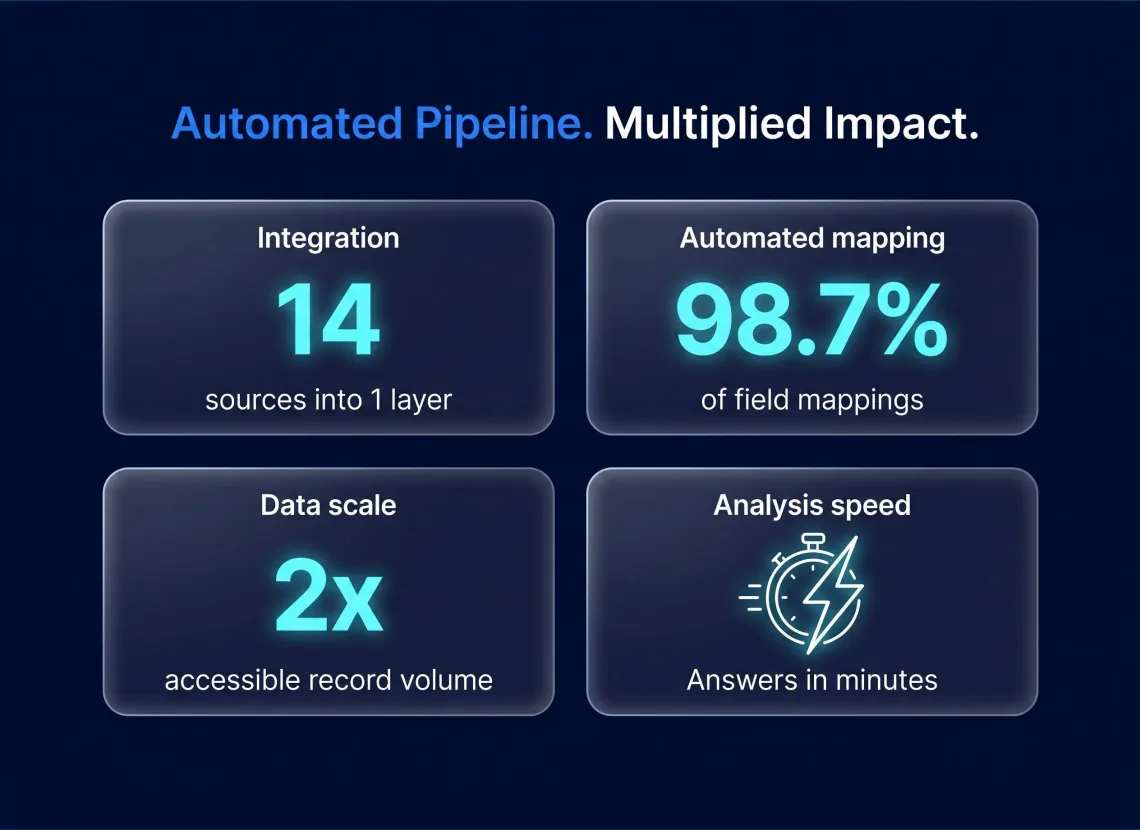
GroupBWT connected 14 of the client’s roughly 20 operational data sources into one validated analytical layer, resolving 98.7% of in-scope field mappings automatically and routing only the remainder for human review.
By having the analytical AI agent route each question to the right tool instead of one general-purpose model, GroupBWT turned questions that previously required manual data assembly into questions the team can investigate in minutes.
Compared with the prior in-house workflow, which queried records from 2020 onward and covered only about half of the available records in that period, the connected layer gives each analysis access to roughly twice the record volume.Daily data ingestion also moved from roughly 1–2 hours of manual work each day to an automated pipeline feeding the same analytical layer.
Want to Ask Your Farm Data Questions Directly?
We can connect the underlying data first, then build a custom analytical AI agent over it so your team can investigate new questions without rebuilding the dataset each time.


You have an idea?
We handle all the rest.
How can we help you?