
Read summarized version with


A lower Snowflake bill matters only if essential dashboards, pipelines, and operational requests still work. First identify which cost category and workload drove the increase, who owns that workload, and which accepted workload output must not regress. A GroupBWT Snowflake cost-and-workload review returns a service-level cost map, workload attribution, prioritized findings, reversible tests with validation measures, and architecture escalation points. When the audit reaches the wider data estate, GroupBWT’s data warehouse services cover the models, pipelines, and reporting layer behind the workload.
Snowflake cost optimization should begin by identifying which cost category grew and tracing that category to its workload, owner, and accepted workload output. If warehouse compute caused the increase, audit one representative warehouse in a closed and settled reporting window, separate attributed query execution from paid idle time, and validate one reversible test against comparable work. Storage, transfer, cloud services, and serverless features each need their own evidence before a warehouse setting is changed.
Snowflake Cost Review
Find What DrivesYour Snowflake Bill
A GroupBWT Snowflake cost-and-workload review connects spend to each workload, owner, service target, reversible test, and validation measure before recommending a change.
You receive:
- A reconciled spend and workload map
- Prioritized checks for idle, query, and serverless cost
- Acceptance measures for each proposed change
The audit turns an account total into one testable decision. Standard virtual warehouses and Adaptive Warehouses use different attribution paths, so the article separates them below.
Start Snowflake Cost Management With the Service That Grew
Pull a closed and settled reporting window from Snowsight’s Cost Management consumption view or from account usage data. Then find the charge that moved. Was it warehouse compute, storage, data transfer, cloud services, or one of the serverless features? Until that is clear, changing a virtual warehouse is guesswork: the extra spend may sit in Automatic Clustering, Snowpipe, retention, replication, or egress instead.
Suppose warehouse compute is the category that grew. Pick a warehouse people recognize and open SNOWFLAKE.ACCOUNT_USAGE.WAREHOUSE_METERING_HISTORY. The compute left unassigned to query execution is:
idle credits = CREDITS_USED_COMPUTE - CREDITS_ATTRIBUTED_COMPUTE_QUERIES
The first column in that subtraction matters. CREDITS_USED includes compute and cloud-services credits, so using it would blend two charges before query compute is removed. By contrast, CREDITS_ATTRIBUTED_COMPUTE_QUERIES captures query execution but leaves idle time out.
Wait for the data to settle. Snowflake’s current WAREHOUSE_METERING_HISTORY documentation gives the Account Usage view a latency of up to three hours, with up to six hours for CREDITS_USED_CLOUD_SERVICES. The attributed-compute column also has a Snowflake behavior-change note warning that latency might reach six hours. Those references do not align perfectly. For the warehouse calculation, use a period that ended at least six hours earlier rather than treating the newest records as final.
Only then move to standard-warehouse query attribution. QUERY_ATTRIBUTION_HISTORY separates the reported execution credits by query and query tag; your account’s tags or ownership convention must map the identified workloads to owners. Snowflake’s QUERY_ATTRIBUTION_HISTORY documentation allows up to eight hours of latency and excludes queries lasting roughly 100 milliseconds or less. Use a window that ended at least eight hours earlier, and allocate no more execution credits than this view reports.
Adaptive Warehouses take another route. WAREHOUSE_METERING_HISTORY returns NULL for their attributed query-compute value, while their jobs are absent from QUERY_ATTRIBUTION_HISTORY. Where it is available, QUERY_METERING_HISTORY supplies per-query credit usage. As of September 2026, Snowflake offers that view only in select AWS regions, and the standard idle-credit calculation does not carry over in the same form.
| Symptom | Data source | Possible cause | First check |
| Warehouse compute rises while hourly query-attributed compute stays flat | WAREHOUSE_METERING _HISTORY |
Idle warehouse time | Calculate CREDITS_USED _COMPUTE - CREDITS_ATTRIBUTED_ COMPUTE_QUERIES by hour |
| Long running periods contain sparse query activity | QUERY_HISTORY plus WAREHOUSE_EVENTS _HISTORY |
Auto-suspend is too long, or schedules leave gaps | Compare query timestamps with recorded suspend and resume events |
| Queries wait before execution | WAREHOUSE_LOAD _HISTORY and query queue time |
Concurrency pressure | Separate queue time from execution time before resizing |
| Query credits rise with bytes scanned | QUERY_ATTRIBUTION _HISTORY plus QUERY_HISTORY or Query Profile |
Weak pruning, broad filters, or repeated transforms | Inspect the highest-credit query family, its scan volume, pruning behavior, and filter pattern |
| Account spend rises outside warehouse totals | Cost Management consumption data and feature history views | Serverless feature, storage, transfer, or cloud-services cost | Break consumption out by service type before changing a warehouse |
Use that table to locate the signal. Once a check confirms it, the next table pairs the finding with one bounded action and a measure for accepting or rejecting the change.
| Finding after the check | What it means | First bounded action | Validation measure |
| Confirmed quiet gaps while the warehouse remains running | Idle compute remains high between accepted workload outputs | Shorten auto-suspend for that warehouse | Idle compute credits fall while the service target holds |
| Queue time dominates and execution is stable | Concurrency or capacity pressure is the immediate symptom; query shape may still contribute | Test workload isolation or a bounded capacity change while checking whether a small number of heavy queries create the pressure | Queue time falls while credits per accepted workload output stay acceptable |
| Execution and scan volume dominate | More compute may accelerate the wrong work | Fix one filter, join, or repeated transformation | Attributed query credits and scan volume fall for the same output |
| Serverless service drives the variance | Warehouse resizing cannot fix the line item | Inspect the feature-specific history and owner | Feature cost falls or its business value is explicitly accepted |
| No owner or service target exists | The team cannot judge whether a saving is safe | Assign the accepted workload output, owner, and service target | The owner can approve or reject the change against a validation measure |
Reconcile Snowflake Query Cost With Idle Warehouse Time
Start with the hourly idle calculation for a standard virtual warehouse in WAREHOUSE_METERING_HISTORY. After that warehouse-level number is known, QUERY_ATTRIBUTION_HISTORY can split the execution credits among queries and tags; the account’s ownership convention then connects those workloads to people. Finance gets two different figures, not one blurred total: compute attributed to query execution and compute consumed when no query execution was attributed.
Do not reuse that workflow for an Adaptive Warehouse. Its CREDITS_ATTRIBUTED_COMPUTE_QUERIES value is NULL. Where available, QUERY_METERING_HISTORY supplies per-query credit usage instead, although as of September 2026 Snowflake limits the view to select AWS regions.
Allocation is still a policy choice. With a dedicated standard warehouse, assign its warehouse compute credits to the owning team and keep query-attributed compute separate from idle compute in the report. A shared warehouse offers several defensible choices: distribute idle by attributed-credit share, use active runtime, or retain it in a shared-platform bucket. Snowflake does not select one for you.
Illustrative worked audit for a standard warehouse
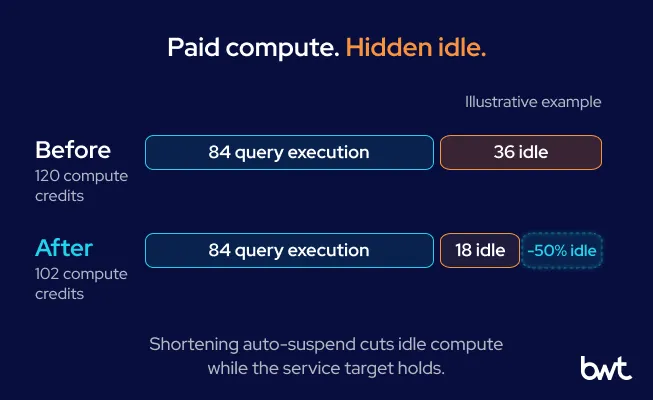
Take an invented example built on Snowflake’s documented warehouse-metering formula. During one closed and settled reporting week, FINANCE_REPORTING_WH consumes 120 compute credits. Query execution receives 84 of them: 63 for finance close and 21 for ad hoc analysis. The remaining 36 are idle. Finance owns all 120 credits at team level, but the workload report leaves those 36 idle credits separate instead of charging them to finance close.
The team shortens auto-suspend for the following completed week. Demand stays comparable: the same number of finance-close and ad hoc runs, similar data volume, and the same required outputs. Execution remains at 84 credits while total compute drops to 102, which halves idle compute from 36 to 18. Dashboard completion slips by one minute, from 18 to 19, but remains inside the illustrative 25-minute target.
Now check what users waited for. Compare suspend and resume events in WAREHOUSE_EVENTS_HISTORY with QUERY_HISTORY, and read QUEUED_PROVISIONING_TIME for the time queries spent waiting while compute provisioned after a resume. Completion still has to meet the service target. Snowflake’s warehouse cost guidance adds another constraint: every provisioned period is billed for at least 60 seconds. If repeated resumes push the workload beyond its target, restore the earlier setting.
Also Read: Decision‑Grade Reporting: The 2026 Overview for ETL and data warehousing
Diagnose the Snowflake Cost Signal Before Choosing a Lever
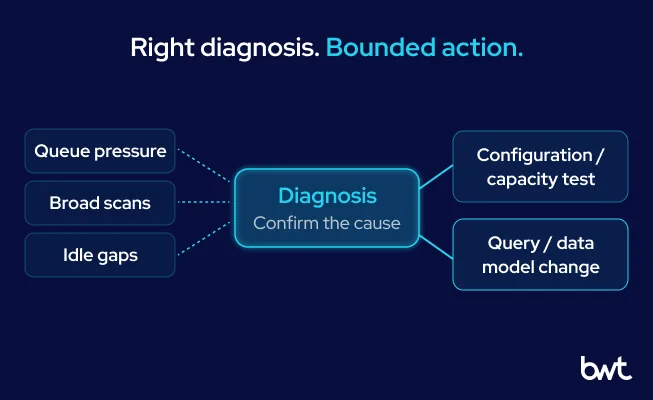
The invoice cannot tell you whether the right response is suspension, query work, isolation, or acceptance of a valuable workload. Queue, scan, spill, and idle evidence make that distinction.
Idle gaps call for schedule and auto-suspend checks. Queue time points toward concurrency or workload boundaries. Remote spill and long execution can justify a warehouse-size experiment, but broad scans and inefficient pruning call for query or data-model changes first. Repeated transformations may be cheaper to compute once and govern as a shared model. Each diagnosis has a different owner and a different regression risk.
Start with the top query families by total attributed credits, grouping recurring patterns by QUERY_PARAMETERIZED_HASH or another stable workload identifier. A moderate pattern run thousands of times can cost more than a rare outlier. Use query tags for business attribution when they identify a pipeline, dashboard, product, environment, or request. Untagged work belongs in a visible unallocated bucket until an owner claims it.
In a Snowflake presale conversation with an operations team, service targets proved essential to the cost discussion. One account supported operational requests that needed immediate answers, dashboards that tolerated minutes, and historical analysis that could wait longer. The observation was not a universal latency taxonomy. It showed that one suspension or sizing policy could not value all three workloads correctly.
For a first pass, write one diagnostic record per material workload: accepted workload output, owner, schedule, cost source, dominant symptom, service target, validation measure, and the next reversible test. This matters more than a long inventory of Snowflake cost optimization strategies because it states what evidence would change the decision.
Alex Yudin puts the diagnostic order plainly: “Do not resize the warehouse because the bill is high. Resize it when queue, spill, and execution evidence show that warehouse capacity is materially constraining the workload. A broad scan on a larger warehouse is still a broad scan – it just finishes the mistake sooner.” — Alex Yudin, Head of Data Engineering at GroupBWT
Match Snowflake Cost Controls to the Charge
Match each warehouse lever to its failure mode. Shorten idle gaps for intermittent compute, test isolation or capacity for queued bursts, and inspect the query profile before resizing expensive execution.
For query work, inspect scans, pruning, joins, spill, and repeated transformations. Automatic Clustering reorganizes micro-partitions to improve pruning but consumes serverless credits. Search Optimization supports selective lookups with build, maintenance, and storage costs. Materialized Views precompute reusable results with refresh and storage costs. Compare each feature’s consumption with the work it avoids.
For storage, split active data from retained history and inspect Time Travel retention, diverged or abandoned zero-copy clones, staging data, and development copies. Before reducing retention or dropping a copy, confirm the recovery window and dependent workload. Retire abandoned copies or shorten retention for reproducible staging data instead of applying one account-wide policy.
For data transfer, map producers, the account region, replication or failover paths, and downstream consumers. Separate an intentional resilience copy from repeated cross-region delivery. The latter may justify co-locating a consumer, changing export cadence, or removing a duplicate path.
Serverless costs need their own history views. Inspect the feature-specific history for Snowpipe, Automatic Clustering, Search Optimization, or Materialized View refreshes. The history identifies which automated feature created the charge and the activity behind it. The team can then compare that consumption with the performance or operational value the affected workloads receive and test cadence, eligibility, or feature scope instead of altering warehouse size. Snowflake’s compute-cost exploration guide describes a daily cloud-services adjustment equal to up to 10% of virtual-warehouse compute usage. Use CREDITS_USED_CLOUD_SERVICES together with CREDITS_ADJUSTMENT_CLOUD_SERVICES in METERING_DAILY_HISTORY to calculate the cloud-services amount actually billed for the relevant SERVICE_TYPE rows.
Cost optimization in Snowflake becomes concrete when the control matches the charge. Warehouse resizing does not directly control Snowpipe, Automatic Clustering, Materialized View refresh, storage, or transfer spend.
Use Native Recommendations, Resource Monitors, Budgets, and User Quotas for Different Jobs
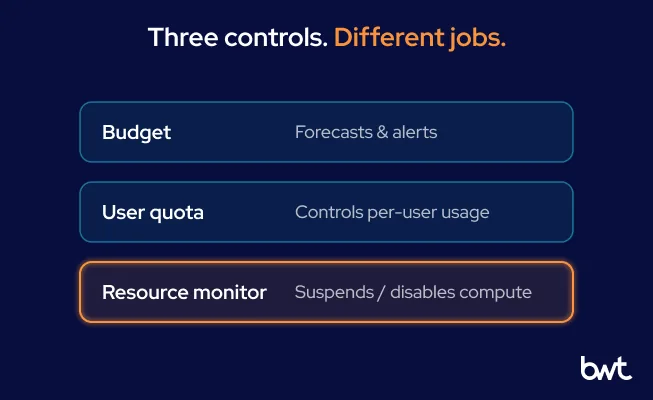
Optimization Insights gives Snowflake FinOps a shortlist, not a verdict. Where the feature is available, it can flag warehouses with long gaps between queries, inefficient multi-cluster use, and underused Automatic Clustering, Materialized Views, or Search Optimization. Its recommendations refresh weekly. Test each one against the actual workload, its service target, and the billed consumption before acting.
| Control | Cost scope | What it can do | Important limit |
| Resource monitor | User-managed warehouses and related cloud-services usage | Notify; suspend standard warehouses or disable Adaptive Warehouses | Excludes serverless features and AI services |
| Budget | Account-wide credit usage, or supported objects and services in a custom budget | Forecast an overrun and notify; optionally call a configured procedure | The spending limit is not a hard stop |
| Per-user quota | Per-user warehouse compute or supported AI-domain consumption | Set monthly and optional daily limits | Warehouse quotas can notify or trigger custom actions; built-in blocking applies only to supported AI domains |
Resource monitors are not precise circuit breakers. Credits can continue accumulating while a standard warehouse suspension takes effect, and the normal action waits for running queries to finish. Adaptive Warehouses behave differently: those resource-monitor actions disable them. Snowflake documents the distinction in Snowflake resource monitors.
Budgets watch a different boundary. They forecast monthly consumption, and Snowflake’s budget documentation allows up to 6.5 hours for the default refresh. Teams can pay for a one-hour refresh instead. A separately configured custom budget action can invoke a reviewed procedure at a threshold, such as one that suspends a warehouse.
Oleg Boyko draws the commercial line here: “An alert is not cost control until one person can explain the variance and choose the response. Automation should shorten that decision, not hide who accepted the risk of stopping a workload.” — Oleg Boyko, CCO at GroupBWT
A Snowflake-related presale conversation exposed the commercial problem behind those controls. An operations team resisted a consumption-based internal charging model once shared access made usage hard to predict. Without a stable owner and usage boundary, nobody could forecast or explain the team’s share. For teams deciding how to automate Snowflake cost optimization, allocation and alert routing come first. Only then should they automate a bounded action, such as suspending idle non-production compute.

Validate Snowflake Cost Changes Against Useful Work
Lower scoped consumption is not sufficient evidence of a successful optimization. Compare the same workload over comparable demand windows.
| Measure | Baseline | Acceptance check | Rollback signal |
| Consumption | Warehouse, query, or feature consumption in scope | Did cost per accepted workload output fall? | Scoped cost rises beyond the team’s agreed range |
| Performance | Queue, execution, and completion time | Did the service target hold? | A critical workload misses its agreed window |
| Reliability | Completed outputs, retries, failures, and quality checks | Did the accepted-output rate hold at or above baseline? | Failure, retry, or rejection rate exceeds baseline |
| Freshness | Data age when consumed | Did the output arrive while it was still useful? | A named consumer misses the decision window |
Change one dominant lever when possible. If you resize compute, rewrite SQL, alter clustering, and shorten retention together, the bill may fall but the team will not know which action worked. Some changes must ship together; record that dependency rather than claiming an isolated test.
Use a representative observation window. A daily pipeline needs ordinary days and its busiest cycle. Finance close cannot be validated on a quiet mid-month Tuesday. Record releases, data-volume changes, and user-demand shifts that would make the comparison unfair.
Treat cost per accepted workload output as a planning measure, not an industry benchmark. Define acceptance before calculation: the output must complete, pass the relevant reliability or quality check, and arrive within its service or freshness window. Failed retries remain in the numerator. A dashboard delivered after its decision window is not an accepted workload output even if Snowflake completed the query.
A sound optimization practice compares spend and accepted workload output within the same observation period.
Hand Off to Architecture When Tuning Repeats the Same Failure
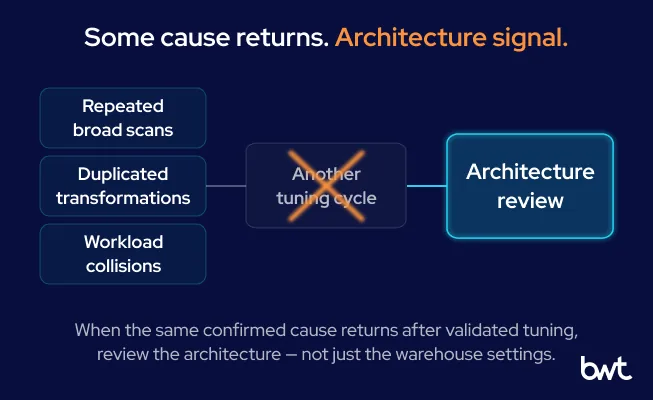
Repeated drift can point beyond Snowflake settings. A daily dashboard that scans years of raw events may need a different model. Several teams rebuilding the same metric may need a shared semantic definition. A near-real-time request forced through a batch design may need another serving path. In those cases, another tuning cycle may reduce the immediate symptom without removing the structural cause.
The handoff starts when the same confirmed cause returns despite a validated tuning change. If query and warehouse changes keep addressing the same scan pattern, duplicated transformation, or workload collision, review data grain, refresh cadence, workload placement, and consumer data contracts and service expectations. For enterprise teams, the guide to data warehouse architecture enterprise explains those design choices in depth.
Dmytro Naumenko separates tuning from redesign this way: “Escalate from tuning when the same confirmed cause returns after an intervention has reduced it under comparable work and passed the service check. At that point, repeated scans, workload collisions, or duplicated models are architecture evidence, not a reason to keep turning the same warehouse setting.” — Dmytro Naumenko, CTO at GroupBWT
A published GroupBWT project offers an adjacent example of that boundary: GroupBWT connected seven disconnected pharmaceutical pipelines through a governed analytical warehouse. It is evidence of architecture modernization, not a Snowflake savings benchmark.
Scoped data warehouse consulting services make sense when several teams share the account, cost allocation remains disputed, or the next fix changes models and downstream reports. If the diagnosis instead exposes pipeline reliability or observability work, data engineering services and solutions are the implementation route. A small team with one owned warehouse and a clear idle gap should run the first bounded test itself before hiring outside help.
Keep Snowflake Cost Optimization Useful After the First Test
Repeat the operational cost split while usage is changing: warehouse compute, serverless compute, cloud services, storage, and data transfer. Investigate variance that is material against the team’s agreed threshold or baseline. Reconcile the full account often enough that savings in one cost category do not hide increased spend in another, then review architecture when the same confirmed cause returns despite a validated intervention. The interval should follow account volatility rather than a universal Snowflake schedule.
A GroupBWT Snowflake cost-and-workload review is most useful when reconciliation crosses teams or exposes an architecture problem. Bring a closed and settled reporting window, the warehouse and service breakdown, workload tags, and the result that cannot regress. The output maps cost by service and, where applicable, warehouse, workload, and owner; records the diagnosis; prioritizes reversible tests with validation measures; and marks where architecture work should replace another configuration change.
Baseline the workload’s cost and service target over the same window. Diagnose idle time, queueing, spill, or scan volume before selecting a control. Roll back when a validation measure for latency, completion, reliability, or freshness regresses.
Inspect the category with material spend or variance first, then identify or assign the workload owner before changing a control. Warehouse compute is often easiest to reconcile, but serverless services, storage, cloud services, or transfer may drive the variance. Break out the service type before applying a warehouse setting.
For a standard virtual warehouse, first calculate hourly idle compute in `WAREHOUSE_METERING_HISTORY` as `CREDITS_USED_COMPUTE – CREDITS_ATTRIBUTED_COMPUTE_QUERIES`. Then use `QUERY_ATTRIBUTION_HISTORY` and query tags to divide execution credits among workloads, map those workloads to owners through the account’s ownership convention, and allocate idle under a written rule. For an Adaptive Warehouse, use `QUERY_METERING_HISTORY` where available for per-query credit usage; as of September 2026, the view is available only in select AWS regions. The standard idle-credit formula does not apply because its attributed-compute field is `NULL`.
Start with reversible actions bounded to a named workload, such as routing an alert or suspending idle non-production compute. Production cancellation, resizing, retention changes, and warehouse suspension need an approved service target and response owner because they can interrupt useful work.
Move from tuning to architecture review when the same broad scan, duplicated transformation, workload collision, or refresh mismatch returns after bounded fixes. The next decision then concerns data grain, shared models, workload placement, or serving design rather than another parameter change.
Runtime and size drive warehouse compute. Automated features add serverless consumption; retained history adds storage; replication and cross-region delivery add transfer charges. Cloud-services usage can also become billable after the daily adjustment.
For a settled standard-warehouse window, calculate idle compute as `CREDITS_USED_COMPUTE – CREDITS_ATTRIBUTED_COMPUTE_QUERIES`. Compare it with query and warehouse events to find paid gaps. Adaptive Warehouses use query-based billing, so this formula does not apply.
Start with a reconciled baseline, workload attribution, and a service target. Match the control to the charge, test one dominant lever, and keep a rollback signal. Reconcile the account afterward so one saving does not hide another cost.
Resource Monitors track assigned warehouses and can notify, suspend standard warehouses, or disable Adaptive Warehouses. Budgets forecast account-wide or supported-object usage and notify on expected overruns. A Budget is not a hard stop without a separately configured custom action.
Read summarized version with
Snowflake Cost Review
Find What DrivesYour Snowflake Bill
A GroupBWT Snowflake cost-and-workload review connects spend to each workload, owner, service target, reversible test, and validation measure before recommending a change.
You receive:
- A reconciled spend and workload map
- Prioritized checks for idle, query, and serverless cost
- Acceptance measures for each proposed change