Read summarized version with


The first to notice a stalled line is rarely the analytics team. It is a plant manager standing at a stopped machine, while the answer to why sits in a PLC log, an ERP export, and a maintenance record that never agreed on what “machine 12” means. Big data on the factory floor is the work of making those systems agree — turning scattered sensor, production, and business data into decisions a plant can act on now, not next quarter. That is what GroupBWT big data development services deliver for manufacturers: the integration layer, the governed lakehouse, and the validation that make ERP, MES, and IoT agree — not another dashboard on top.
Big data in manufacturing means collecting, integrating, and governing high-volume, high-variety data from across the plant — ERP, MES, SCADA, PLC, IoT, quality, maintenance, and supply chain systems. Put to work, it raises overall equipment effectiveness (OEE) and flags downtime before the line stops. It also catches defects sooner, tightens production, steadies inventory forecasts, and lays the data foundation AI and smart-factory programs depend on.
Unify Your Plant Data
We build the integration layer, governed lakehouse, and validation that make ERP, MES, and IoT agree — the foundation manufacturing AI depends on.
Key Takeaways
- Big data connects machine, sensor, ERP, MES, SCADA, and IoT data into one governed model — the integration is the work, not the model.
- In our manufacturing data projects, the clearest operational payback tends to come from five use cases: predictive maintenance, quality analytics, production optimization, inventory forecasting, and energy monitoring.
- The biggest challenge is rarely the AI model — it is data integration, quality, and governance.
- AI in manufacturing scales only when the data foundation underneath it is reliable.
- The fastest payback starts with one fragile feed and one owned KPI, not a broad platform program.
Definition of Big Data in Manufacturing
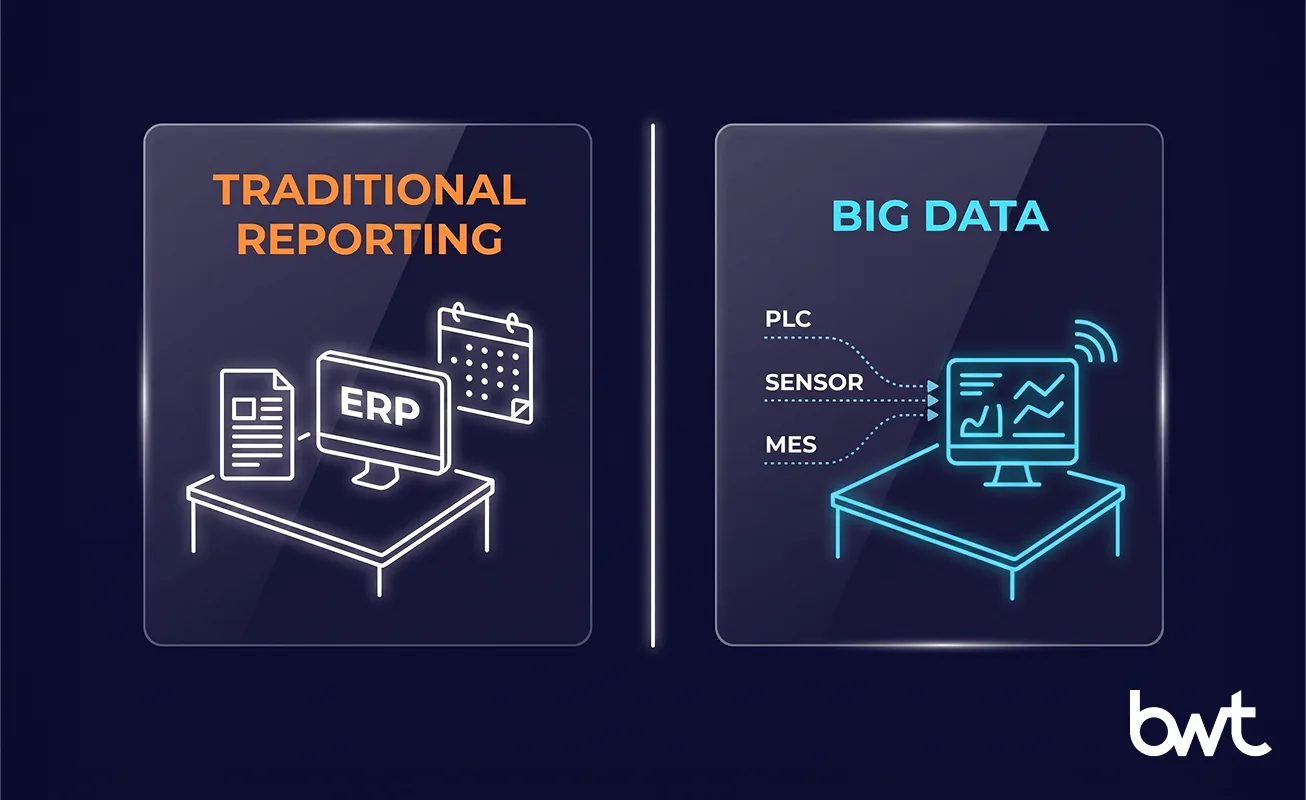
Big data on a factory floor means high-volume, high-variety data arriving at very different speeds — from machines and IoT devices to ERP, MES, and quality systems — collected and modeled for decisions a spreadsheet cannot support. It is dozens of feeds, useful only once they share a common meaning.
This article covers the layer underneath the dashboard: how manufacturers collect, integrate, store, govern, and process that data at scale. The analysis and KPIs that sit on top — OEE, scrap, root cause, forecasting — are the decision layer, and the foundation here is what makes them trustworthy.
Volume: Billions of Machine and Sensor Readings
A single asset-heavy plant can produce billions of readings a day. Configurable products multiply into thousands of SKUs and permutations — one configurable-product manufacturer tracked 70,000+ parameter combinations per region. Controllers and sensors keep adding to that pile every second the line runs.
Velocity: Data Arriving From Milliseconds to Batch Exports
The floor does not move at one speed. A safety-critical PLC signal arrives in milliseconds. An environmental sensor reports every few minutes. An ERP export lands once a night. Big data has to hold all three cadences at once — streaming, micro-batch, and nightly batch in the same model.
Variety: ERP, MES, SCADA, PLC, IoT, Quality, and Supply Chain Data
Each of these — ERP, MES, SCADA, historian, IoT — labels the same machine, batch, or part its own way. None ships with a shared key. So the first big data application in manufacturing is not analytics at all: it is forcing those systems to agree on what “machine 12” means, which folds the raw volume into one model instead of dozens of disconnected feeds.
How Big Data Differs From Traditional Manufacturing Reporting
Traditional reporting summarizes one or two systems after the fact; big data continuously joins many.
| Dimension | Traditional reporting | Big data in manufacturing |
| Data sources | One or two systems (often ERP + Excel) | Dozens: PLC, sensor, MES, ERP, quality, supply chain |
| Data volume | Thousands of rows per report | Billions of readings per day |
| Timing | Periodic, compiled after the fact | Continuous, streaming and batch together |
| Where errors surface | In the finished report, after a decision | At ingestion, before a number reaches a dashboard |
| Primary purpose | Explain what already happened | Current-state visibility, prediction, and operational decisions |
Why Big Data Matters in Manufacturing
Unifying that data shortens the distance between an event on the floor and a decision in the office. That is how big data is being used in manufacturing today — less a reporting upgrade, more an operating change. Most plants act reactively, noticing a defect only after the batch ships; unified data turns an after-the-fact summary into a current view someone can act on the same day.
So how does big data help efficiency in manufacturing? It removes the manual reconciliation between a question and its answer, so the owners of margin and OEE read one number everyone trusts. Every smart-factory ambition — predictive maintenance, digital twins, autonomous quality — runs on the same foundation. Across the big data in manufacturing industry, that clean, unified, current data separates the programs that scale from the ones that stall.
Main Sources of Big Data in Manufacturing
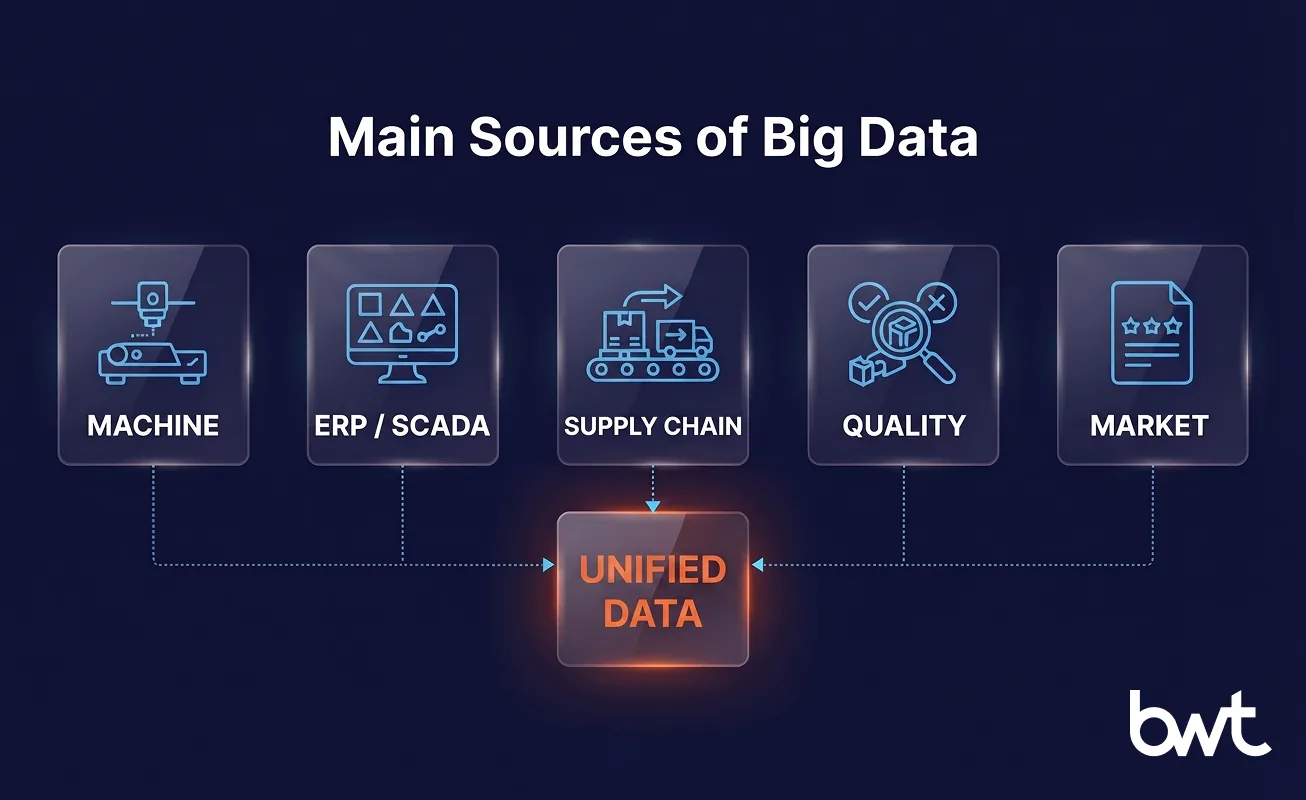
The data comes from five families of systems, none built to talk to each other. Each brings its own volume, cadence, and format, which is why the first job is integration, not analysis.
Machine, Sensor, PLC, and IoT Data
The highest-volume, highest-velocity source on the floor. PLC logs, historians, and environmental monitors fire from milliseconds to minutes, around the clock — raw telemetry a lakehouse has to ingest as a stream, never as a nightly file.
ERP, MES, and SCADA Data
Orders, schedules, work orders, shop-floor execution. These systems of record give a bare sensor reading its business context, and because each one names the same machine, batch, and part its own way, this is where most of the identity-matching work lives.
Supply Chain, Inventory, and Logistics Data
Supplier, stock, and movement records set what a plant can actually build. It is often the messiest tier to integrate — the data arrives from outside the plant network, in supplier-specific shapes that change without warning.
Quality, Inspection, and Maintenance Data
Inspection results, defect images, closed work orders, confirmed good-vs-scrap outcomes. This is the labeled data. Without it a sensor stream is just numbers — the labels are what turn it into something a model can learn from.
Customer, Field Service, and Market Data
Reviews, field-service logs, competitive pricing — the signals that tie the plant back to demand. Usually external, usually unstructured, and often with no API, so it has to be collected before it can join anything else.
None of the five shares a common identifier by default, which is why the first job on the floor is not analysis but agreement — making every system describe the same machine, batch, and part the same way.
Big Data Use Cases in Manufacturing
So how is big data used in manufacturing industry at scale? The analytics and the KPI sit on top; the hard part underneath is the data workload each one demands. Every big data use case in manufacturing is really a join problem — a specific set of sources that have to land together, at the right cadence, before any decision is possible:
- Predictive maintenance. The workload is a join: high-frequency telemetry against failure history and work-order labels. Sensor streams tell you the state of a bearing or motor. The labels — which past readings ended in a breakdown — are what let a model catch the pattern before the line stops.
- Quality analytics. Here you line up three things on the same part: the line-scan image, the process conditions at that moment, and the confirmed pass-or-scrap verdict. Get them aligned and a defect surfaces earlier, with a cause attached. Miss the alignment and you have three disconnected records.
- Throughput optimization. MES events, machine states, downtime reasons — reconciled minute by minute. What the schedule said rarely matches what each machine actually did, and the gap between the two is where the real bottleneck hides, not the assumed one.
- Inventory forecasting. A forecast is only as good as the agreement between ERP, supplier feeds, inventory, and demand signals. What is on hand, what suppliers can deliver, what demand is pulling — three systems that almost never agree on a part number until someone makes them.
- Energy monitoring. High-frequency metering on its own is noise. Tie it to which machine ran which job when, and it turns into a per-unit energy cost an operator can actually act on.
Scoping any of these starts with the data source, which rarely admits how much it holds — volume discovery comes before the model, not after.
"On one automotive manufacturer’s catalog, we found 165,000 parts behind a 1,250-results-per-query cap — a single category held over eight million entries. You never know the real volume until you’ve fought the source."
— Alex Yudin, Head of Data Engineering, GroupBWT
Ready to scope your first use case? Talk to our data engineering team about the one feed that breaks your reporting most often.
Real-World Big Data Examples in Manufacturing
The clearest big data examples in manufacturing are not dashboards — they are the integration work underneath them. Each is a production engagement.
- Multi-site data platform. An industrial-scale producer ran 12 plants across 8 U.S. states on a 12-year-old SQL Server estate, with reporting scattered across roughly 20 disconnected systems. Discovery alone surfaced 6,000+ tables before we rebuilt a single use case. The completed migration then pulled all of it onto one governed lakehouse, built with end-to-end data warehouse solutions — and the next ten reports read from that one source instead of twenty.
- Competitive pricing for automotive. A Fortune 500 automotive manufacturer set strategy from quarterly competitor reports running 3 to 12 months behind the market. We built a continuously refreshed competitive-pricing dataset behind a live dashboard, replacing 3-to-12-month-old reports with a current daily market view.
- Catalog and supply-chain normalization. A global decorative-cosmetics manufacturer received every retailer’s product data in a different shape. GroupBWT normalized each file into one model with a reusable ingestion template, giving the brand a single shelf view across every retailer — a new retailer’s data live the next day instead of after a week of one-off scripting.
- Consumer review analytics. A European mattress manufacturer needed a defensible product position. We pulled 1.5M+ reviews from 10+ countries into one analyzable dataset. Grounding its product decisions in what buyers actually wrote, the brand reached a #1 marketing position.
Benefits of Big Data in Manufacturing
The benefits of big data in manufacturing are operational before they are strategic. Hours saved. Decisions made sooner. In practice they show up as five shifts:
- Better operational visibility. One shared view of OEE, throughput, scrap, and on-time delivery — not a different spreadsheet at every site.
- Faster, more accurate decisions. The business acts on what is happening now. Last week’s snapshot stops driving today’s call.
- Lower costs — bottlenecks and energy waste stop hiding. Once they are visible, they are fixable.
- Higher quality, less waste — catch a defect earlier and you scrap and rework less of the batch.
- Stronger forecasting. Unified demand and supply signals sharpen what actually gets built.
None of it arrives before the foundation does.
Big Data Architecture for Manufacturing
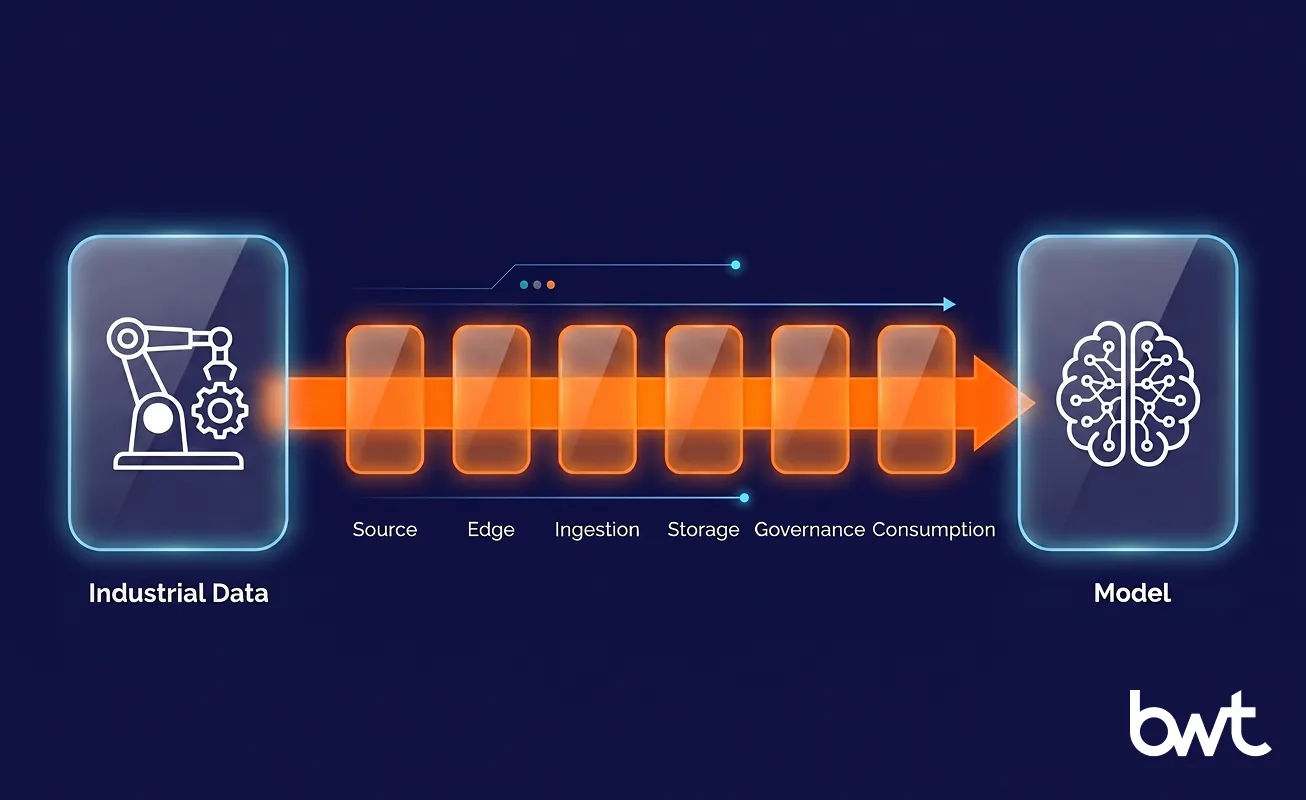
A working architecture moves plant data through six layers — from the machine that produces it to the alert or model that acts on it. Each layer solves one problem the layer before it cannot.
| Architecture layer | Role |
| Source | ERP, MES, SCADA, PLC, historians, IoT |
| Edge | Protocol translation, buffering, local processing |
| Ingestion | Batch, streaming, and CDC |
| Storage | Raw, cleaned, and business-ready layers |
| Governance | Catalog, access, lineage, and quality |
| Consumption | BI, KPIs, alerts, ML, and AI |
1. Data Sources: ERP, MES, SCADA, PLC, Historians, and IoT
Everything starts with the five source families above — dozens of systems, each describing the same machine, batch, and part in its own shape. The architecture’s whole job is to make them agree.
2. Edge and Industrial Connectivity
Collection has to respect the plant floor. Bridging a proprietary PLC means working through industrial protocols — OPC-UA, Modbus, and MQTT via edge gateways — without breaching the network separation between factory equipment and IT. The edge layer translates protocols, buffers readings when a link drops, and can process time-critical signals locally.
3. Batch, Streaming, and CDC Ingestion
From the edge, change-data-capture ingestion keeps one governed model current — where “machine 12” and “batch 4471” mean the same thing everywhere — instead of a new script per source. Streaming carries fast signals, micro-batch and nightly batch carry the rest, and all three land in the same model.
4. Lakehouse Storage and the Medallion Architecture
The data lands in three layers: raw keeps every reading as sent, cleaned fixes types and duplicate timestamps, and business-ready defines OEE, scrap, and throughput once for everyone. On a lakehouse that is the Medallion pattern — bronze, silver, gold. Which platform runs it is a workload call, not a brand allegiance. Databricks is often a strong fit when data engineering, streaming, and ML workloads need to share one platform, while Snowflake is frequently chosen for SQL-centric analytics, governed data sharing, and warehouse-first workloads. On-prem still wins when the data cannot leave the plant network.
5. Governance, Catalog, and Data Lineage
One catalog governs the whole store — access control, data quality, and lineage every number can be traced back through. This is the layer that makes a KPI defensible: when a plant manager questions a figure, you can show exactly which readings produced it.
6. BI, Machine Learning, KPIs, and Operational Alerts
The top layer serves the decision, and the decision sets the cadence — not a default. A machine-control or safety-critical signal needs local or edge handling. An OEE dashboard does not. BI, KPIs, alerts, and models all read from the same governed source, so one number carries the same meaning whether it lands in a report or trains a model.
Big Data Challenges in Manufacturing
The hard part of a program is rarely the model. Four challenges surface first:
- Legacy systems and silos. Decade-old ERP and dozens of undocumented systems rarely share an identifier. The right first move is an inventory, not a rebuild.
- Dirty plant data. Missed readings, sensor drift, values stuck on one number, and duplicate timestamps from buffered controllers are the norm. Then there is schema drift: a source quietly renames a column, and the join breaks in silence. The load corrupts with no error thrown. Catching it takes explicit schema alerts and validation gates at the door.
- Governance, security, and compliance. Manufacturing data carries obligations: ISO 9001, IATF 16949, audit trails on regulated lines. Governance has to sit inside the pipeline from the start, not get bolted on after an auditor’s finding. The harder conflict is internal: innovation and sales push for the cloud, while IT and owners block it over data security, confidential formulas, and regional compliance rules. A data partner has to resolve that fight before the architecture — which is exactly why on-prem still wins whenever the data cannot leave the plant network.
- Scaling across sites. Multi-site rollout is where analytics quietly fails to scale: most of the cost is integration and governance per plant, and an acquisition can double the gap overnight.
How Manufacturers Use Big Data With AI and Advanced Analytics
Inside the big data in manufacturing industry, AI rarely fails on the model. It fails on the data. And even when a model works, the payoff stays thin: adoption is uneven, and only about 20% of AI-adopting organizations have turned it into revenue growth despite 74% trying, State of Generative AI in the Enterprise (Deloitte, 2026) reports. That gap is why, in the programs that actually ship AI, the sequence for how big data is used in manufacturing industry is fixed: data foundation first, model second.
- Predictive maintenance, done as ML. Labeled work-order and scrap history plus live sensor data feed a classifier that learns the patterns before a failure. Where a plant has no failure labels yet, GroupBWT starts with unsupervised anomaly detection and graduates the model as the history builds.
- Anomaly detection and quality at the line. Line-scan vision and process data feed a model tuned to the cost of a false alarm versus a missed defect. Caught earlier, scrap drops.
- Real-time decision support. Dozens of asset signals refreshed on a tight cadence feed a live operational map — the call happens in front of the people who act, not after the next report lands.
Every model above depends on the same input: a governed, current data source. Without it the model starves — which is why the data work, not the algorithm, decides whether AI in manufacturing ships.
Best Practices for Implementing Big Data in Manufacturing

These practices answer how to use big data in manufacturing without funding twenty pilots that never ship. Run them as a checklist:
- Unify your sources into one governed model where “machine 12” means the same thing everywhere. Done when every new use case reads from this model instead of a fresh per-source script.
- Build pipelines for the next ten sources, not the first. Done when adding a source is a configuration change, not a project.
- Validate at ingestion, not after a bad report — far cheaper than retrofitting governance after a model has learned from bad data, the case we make in our guide to how to architect data readiness for AI?. Done when a bad load is caught before it reaches a dashboard.
- Tie every pipeline to a KPI someone owns — OEE, scrap, or on-time delivery, each with a named owner.
The Future of Big Data in Manufacturing
Across the big data in manufacturing sector, the direction we see in our own projects is less about new buzzwords and more about where the decision happens. Owners no longer ask for another dashboard — they ask for the decision to move closer to the machine, and for one governed source every model can read from instead of a separate pipeline per tool. Edge handling for time-critical signals and digital twins that test a change before it touches the floor both depend on the same thing they always have: a clean, unified data foundation. The teams that win the next few years fix that foundation first.
When to Partner With a Big Data Provider for Manufacturing
Bring in help when sources multiply faster than your team can integrate them, when a migration must run without taking dashboards offline, or when an acquisition doubles your systems — the trigger is usually a capacity ceiling, not a skills gap. A good partner builds the unglamorous foundation: multi-source integration, a governed lakehouse, validation, and a semantic layer that makes KPIs mean the same thing across sites. GroupBWT delivers this as data engineering services company — custom big data systems, not off-the-shelf dashboards — the half of the big data in manufacturing industry that decides whether everything above it works.
Press a prospective partner on specifics: how they keep a pipeline stable when a controller’s schema drifts mid-project, and how they run a migration in parallel so no dashboard goes dark. And if downtime is already low and rejects are stable, the right first project may be a data-readiness assessment, not a model.
"Be honest about the bill: a managed data team usually costs more than the in-house headcount it replaces. You are buying speed and a number you can trust, not cheaper labor — a plant chasing only lower cost should keep the work in-house."
— Oleg Boyko, CCO, GroupBWT

Build a Smarter Manufacturing Data Strategy
Manufacturing big data pays back when the foundation is right and stalls when it is not. So the first move is rarely a model — it is almost always the data underneath one. Across the big data in manufacturing industry, the teams that fix the data first are the ones that pull ahead. Bring us one fragile ERP, MES, SCADA, PLC, or IoT feed, and GroupBWT will map what it blocks — reporting, AI, or predictive analytics — and show what it takes to make that feed trustworthy. Get a Manufacturing Data Readiness Assessment.
"Data readiness is the honest first question, not the platform. Fix the feed a wrong number rides on before you buy the model — that is the sequence GroupBWT holds to."
— Dmytro Naumenko, CTO, GroupBWT
It starts with integration. Manufacturers pull machine, sensor, ERP, MES, SCADA, and IoT data into one governed model, then turn that model into decisions on the floor. Unified, it feeds predictive maintenance, quality and defect analytics, throughput optimization, inventory forecasting, and energy monitoring — each use case reading from the same trusted source instead of a fresh per-system extract. Skip the foundation and nothing built on top of it, analytics or AI, can be trusted.
Five recur: predictive maintenance, quality and defect analytics, throughput optimization, supply-chain and inventory forecasting, and energy monitoring. Each ties one specific data source to a decision an operator or manager already owns. Payback tends to land first on predictive maintenance and quality analytics — and both start by mapping a single data source, not by buying a platform.
It cuts out the manual reconciliation between a question and its answer. The owners of OEE and margin act on one trusted number instead of rebuilding spreadsheets each week. Join MES and machine data and the real bottleneck shows itself — not the assumed one — while continuous energy and throughput data makes idle capacity visible and fixable. Onboarding a new source drops to a configuration step, not a week of scripting. Once every system agrees, the decision takes minutes rather than waiting on the next report.
Three parts, really: industrial connectivity, a cloud data platform, and a governance layer. Data leaves PLCs, sensors, and historians over protocols such as OPC-UA, Modbus, and MQTT, then rides change-data-capture into a lakehouse organized in raw, cleaned, and business-ready layers — the Medallion pattern. On top, platforms such as Databricks or Snowflake serve analytics, machine learning, and BI, while a catalog handles lineage and access control.
Big data is the foundation every manufacturing AI model depends on: labeled work-order and scrap history plus live sensor data are what a predictive-maintenance or quality model learns from. Without clean, unified, current data the model starves, which is why the data work — not the algorithm — decides whether AI ships. AI in manufacturing scales only when that governed data foundation is reliable.
Read summarized version with
Unify Your Plant Data
We build the integration layer, governed lakehouse, and validation that make ERP, MES, and IoT agree — the foundation manufacturing AI depends on.