Leaders use the beauty industry’s competitive analysis as a financial instrument. Teams read digital shelf telemetry, retail sell-through, and claim-level proof.
One missed data signal cuts promo ROI within weeks. A validated claim that wins testing can add two gross-margin points in premium segments.
What Competitive Analysis Means in the Beauty Industry
Analysts frame beauty competitive analysis as a discipline linking claims, channels, and cost bases.
It is narrower than broad market research because each output must convert into a pricing, inventory, or marketing move within 30 days.
Core Definition and Boundaries
Competitive analysis isolates product-level claims, category baselines, and distribution power. Broader research describes consumers; competitive analysis dictates margin moves.
Competitive Analysis of Beauty Products 2025
Scope includes pre-launch validation, launch elasticity tests, and post-launch GTIN/EAN phase-out or scaling.
Applied Frameworks for Decision Makers
Executives map forces through Porter’s Five Forces adjusted to beauty, adding consumer behavior lenses such as product concern (eg, anti-aging, hydration), usage occasion (daily routine, travel), and basket companions (items typically purchased together).
Beauty Industry Competitive Analysis: Market Overview
Beauty competitive landscape analysis begins with a single baseline. TBRC’s Global Beauty and Personal Care report values the sector at current billions, shows CAGR, and names tariff and natural-ingredient trends as growth levers.
Global Market Size and CAGR
TBRC highlights market expansion with a steady CAGR. Executives treat CAGR not as abstract growth, but as a capital-allocation guardrail.
Regional Hot Spots
Asia, LATAM, and North America deliver contrasting growth and tariff exposure. Growth pulls working capital; tariffs compress margin.
Macro Trends in Demand
Natural ingredients, sustainability preferences, and tariff shifts redirect portfolios. Category strength varies by region.
Executives use CAGR not as a growth aspiration, but as a guardrail for capital allocation and hiring pace.
How Competitive Is the Cosmetics Industry?

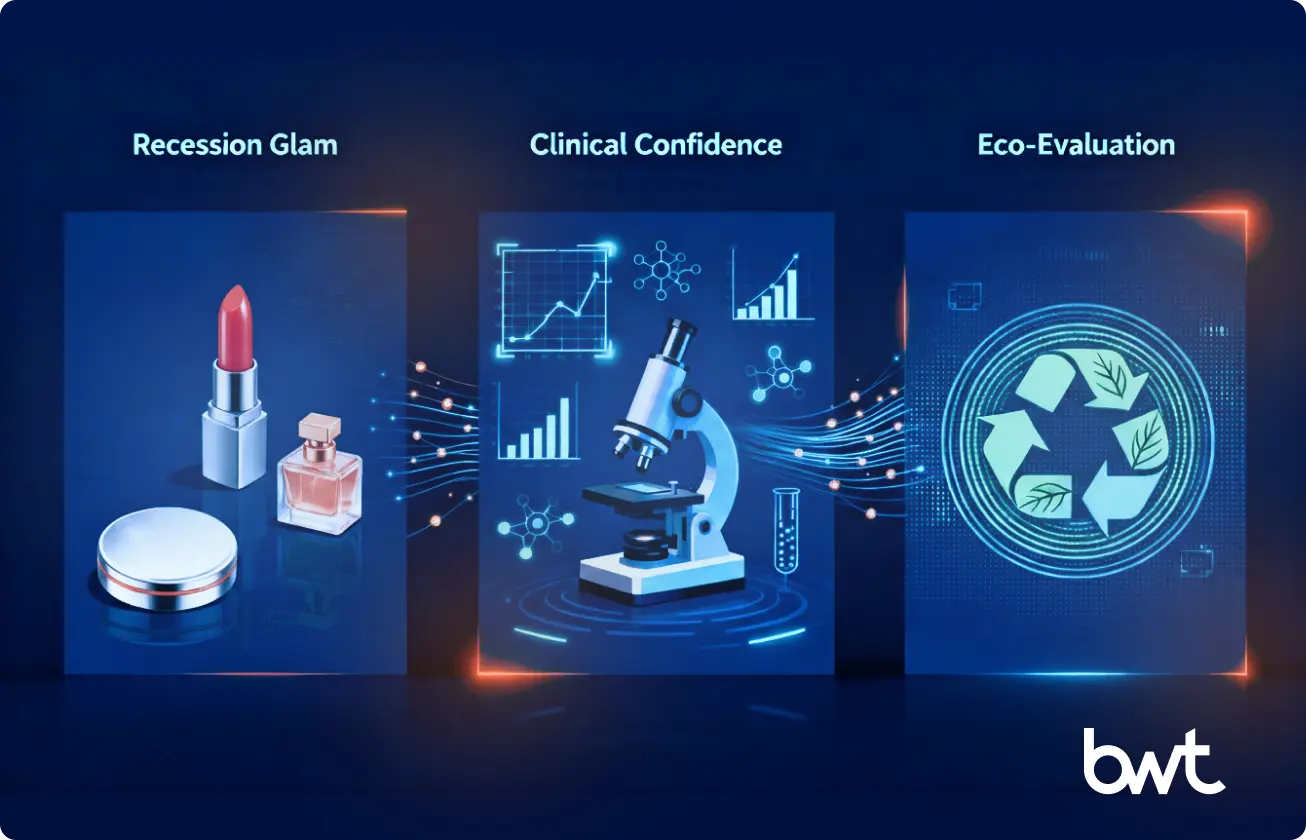
Competition in cosmetics sharpens around consumer behavior shifts. Euromonitor’s 2025 report names three defining forces: Recession Glam, Clinical Confidence, and Eco-Evaluation.
Each trend alters buying habits and reshapes pricing power. Executives must track these forces because they redirect category growth and squeeze margins unevenly across regions.
Recession Glam and Value Demand
Consumers trade down on luxury but still spend on small indulgences. Euromonitor highlights resilient purchases in lipstick and entry-level skincare. Firms that shift pack sizes preserve unit sales while holding shelf presence.
Clinical Confidence as Proof Standard
Buyers demand scientific validation. Clinical claims—measurable results from in vivo trials, in vitro tests, or dermatologist-supervised studies—now drive faster adoption than celebrity campaigns. Brands without verified test data risk slower uptake and weaker repeat rates.
Eco-Evaluation and Sustainability Stakes
Eco-evaluation now covers packaging recyclability, ingredient sourcing, and carbon footprint, with region-specific standards. In the EU, compliance centers on packaging rules and certified sourcing (eg, COSMOS, Ecocert).
In the US, USDA Organic and recycling claims dominate. In Asia, disclosure rules emphasize carbon metrics and traceable supply chains. Weak claims invite regulatory fines and customer churn, while strong ESG proof increases pricing tolerance.
Tools and Data Sources for Beauty & Personal Care Competitive Market Analysis
Beauty competitive market analysis depends on precise data streams. Analysts integrate syndicated research, social listening, GTIN/EAN scraping, and AI-powered diagnostics.
Research and Markets projects the AI beauty and cosmetics market will reach $4.4 billion in 2025 , doubling to $9.44 billion by 2029 at a CAGR of about 21% . These tools reshape not only consumer experience but also the analyst’s toolkit.
Syndicated and Retail Data Feeds
NielsenIQ and Similarweb supply traffic baselines and sell-through signals. Firms align promotions when competitor traffic surges or when basket sizes contract.
AI Tools for Diagnostics and Personalization
AI diagnostics and virtual try-ons reduce return rates and strengthen conversion. Research and Markets quantifies their impact by showing market growth above 20% annually.
Data Scraping and Custom Dashboards
Delivery teams deploy compliant scrapers to track GTIN/EAN-level prices and promo calendars. Dashboards fuse this stream with syndicated data, cutting analysis cycle time by measurable double-digit percentages.
Strategic Frameworks for Beauty Competitive Analysis
Operators use beauty industry competitive analysis to turn signals into moves. Teams choose frameworks that compress cycle time and protect margin.
Three methods dominate: SWOT for clarity, benchmarking for speed, and predictive analytics for foresight.
The stack works when each layer ends with a decision: change price, adjust claims, or re-route inventory.
Rhythm matters. Fast reads prevent stale actions. Clean inputs raise confidence in the next bet.
SWOT That Drives a Decision
Analysts write one-page SWOTs per brand or GTIN/EAN. Strengths map to claim proof. Weaknesses map to pack, price, or channel gaps. Opportunities set the next test. Threats set a guardrail.
Benchmarking That Surfaces Deltas
Teams track price ladders, promo cadence, review velocity, and content freshness. Benchmarks reveal where to gain pricing power or cut waste. Deltas guide weekly actions.
Predictive Analytics That Allocate Capital
Forecasters blend sell-through, search volume, and promo history. Models rank scenarios by contribution margin and inventory risk. Leaders move the budget where probability meets upside.
Case Example: A Global Brand’s Data-Driven Product Strategy

In the beauty competitive analysis case, a cosmetics brand faced a six-month product update cycle. That lag created a gap between consumer demand and new product launches. The delay risked relevance, slowed revenue capture, and exposed the brand to faster regional competitors.
System Build: Competitive Intelligence as Architecture
The brand’s delivery teams partnered with GroupBWT to engineer a monitoring system. Instead of broad market reports, the system captured SKU-level competitor data across key retailers.
Fields included GTIN/EAN, product name, and stock status. This narrow stream created reliable comparability, allowed early detection of product cycle shifts, and reduced the risk of misaligned pipeline bets.
Processing Layer: From Raw Signals to Product Decisions
Analytics teams interpreted the competitor data into structured insights. They tracked sales velocity, inventory stability, and emerging product gaps.
Findings exposed voids in the category mix and mapped clear consumer preferences. Product managers then aligned the pipeline to these signals, replacing intuition with quantified decision paths. Guesswork dropped. Decision cycle speed increased.
System Outcomes: Quantifiable and Repeatable
Implementation produced measurable business results. The product line aligned more closely with current demand, improving sales cadence and strengthening retail presence. Three system principles anchored the outcome:
- Predictive Analytics : Forecasting from historical competitor data cuts error rates, ensuring launches matched emerging consumer pulls.
- Benchmarking : GTIN/EAN analysis created a yardstick against direct rivals, sharpening pricing power.
- Analysis-to-Action Cycle : The closed loop ensured that data signals translated into product moves within weeks, not quarters.
By moving from intuition-driven choices to evidence-anchored actions, the brand preserved market share and defended gross margin.
The case shows competitive intelligence as a direct lever for pipeline governance, aligning launches with demand while reducing the cost of misfires.
Trends Reshaping Competitive Landscape Analysis in the Beauty Industry
Trends tilt the board. Executives run a competitive landscape analysis against four moving fronts: AI engines, ESG, omnichannel splits, and regulation.
McKinsey’s State of Beauty 2025 expects the global market to grow ~5% annually through 2030 and flags value examination as a defining theme among leaders.
Use that cadence to plan budgets and hiring. Growth persists. Discipline decides winners.
AI and Personalization Engines
AI compresses testing cycles and improves claim targeting. Teams integrate shade matching, regimen advice, and dynamic bundles. Data quality sets the ceiling.
Sustainability and ESG Mandates
Sourcing proof and recyclability shape pricing tolerance. Brands without verified trails face fines and faster churn. Audits move from annual to continuous.
Retail/Omnichannel Integration (China vs. US vs. EU)
China rewards speed and social-commerce hooks. The US rewards shelf authority and DTC hygiene. The EU rewards compliance precision. Playbooks must diverge.
Regulatory Complexity
Green claims rules and safety standards harden. Label accuracy becomes a margin lever. Errors drain cash and trust.
Challenges and Limitations of Beauty Industry Competitive Analysis

Great analysis still meets friction. Teams face data-privacy limits, influencer bias, and over-reliance on secondary sources.
Leaders reduce risk by triangulating inputs and logging assumptions. The point is clarity, not volume. Strong process shields the margin when signals conflict.
Privacy and Compliance
Analysts respect robots’ rules, ToS, and PII constraints. Compliant methods preserve access and avoid legal drag. Clean logs de-risk audits.
Influencer and Review Bias
Outliers skew sentiment. Teams are weighted by verified purchase, recency, and cohort. Noise drops. Signal remains.
Secondary-Source Dependence
Single-source narratives mislead. Operators cross-check with retail data, consumer panels, and first-party telemetry. Diversity raises truth.
Influencer bias, for instance, skews SPF product reviews in summer spikes, overstating baseline demand.
Future Outlook: The Competitive Edge in Beauty 2030
The edge shifts toward AI-native operators, pharma-grade claims, and circular packaging. Teams that measure truth win cycles.
Beauty industry competitive analysis becomes a living system: models learn, dashboards guide, humans decide. Speed rises. Stakes rise. Calm process prevails.
AI-Native Competitors
Builders bake diagnostics and personalization into core journeys. They treat every interaction as structured data. Feedback closes loops.
Pharma-Beauty Convergence
Clinical standards push higher. Pipelines mimic medical device discipline. Claims turn into contracts with consumers.
Circular Beauty at Scale
Refill, recycle, and track. Packaging becomes a pricing lever. Proof earns a margin.
FAQ
-
What is a beauty industry competitive analysis?
Beauty competitive analysis is a focused branch of market analysis. It isolates competitor product signals—GTIN/EAN identifiers, claims, price ladders, and review velocity—and converts them into pricing, promo, and inventory actions. Unlike broader market analysis, which captures consumer attitudes and macro trends, competitive analysis sets a defined decision window and links each read to an operational move. The practice assigns owners, triggers, and fallback actions to protect margin in fast shifts.
-
Which weekly metrics matter most?
Weekly reads center on price ladders, promo cadence, content freshness, and review mix. These metrics expose deltas early, so operators adjust pack sizes, claims priority, and shelf tactics before drag compounds. The loop documents hypotheses, outcomes, and the next micro-test.
-
How to do teams benchmark GTIN/EAN correctly?
Benchmarking starts with GTIN/EAN keys and a shared catalog schema. Analysts pair identifiers with title, brand, size, color, and image hashes to raise match precision across retailers. This method stabilizes comparisons, reduces false matches, and keeps price ladders trustworthy.
-
How do analysts stay compliant while scraping?
Compliance starts with public pages and the site’s robots.txt rules. Systems pace requests, honor terms of use, and exclude personal data with logged proof of source and cadence. This discipline preserves access, keeps evidence defensible, and lowers audit risk.
-
How do operators convert analysis into 30-day actions?
Operators predefine triggers and levers before the read. A price-ladder gap triggers a markdown test, a claim gap triggers copy and asset refresh, and a velocity gap triggers pack-size trials. The team the smallest ships test, measures the delta, and scales only proven moves.


